
Below is a security correlation calculator which analyzes daily return correlations between stocks, ETFs, and mutual funds. Use this tool to identify portfolio diversification opportunities, measure how securities move together, and optimize your investment strategy based on return correlation relationships.
There are thousands of securities in the database including stocks, ETFs, and mutual funds. Correlation data is accurate to within the last 7 days of returns and includes comprehensive statistics for portfolio analysis.
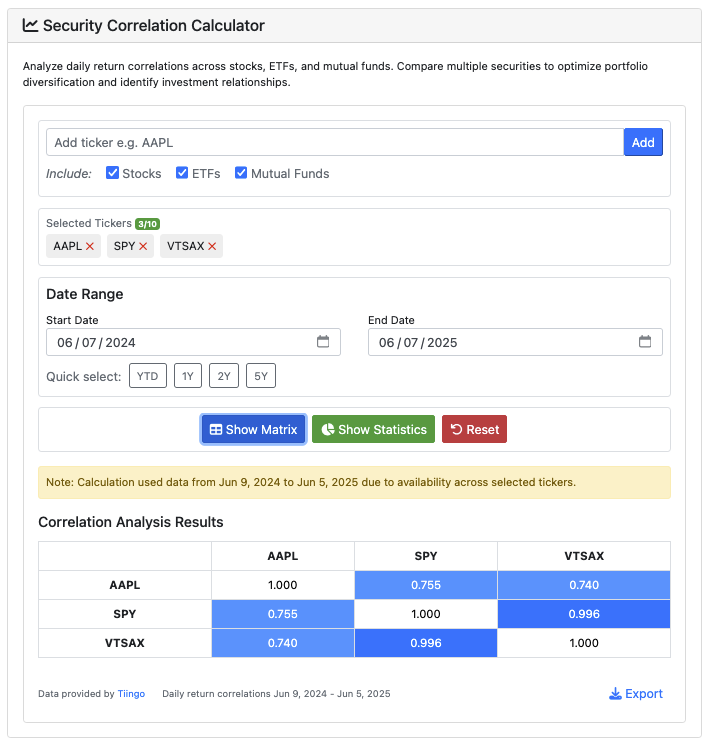
Security correlation calculator and portfolio analysis tool
Also, see our specialized correlation calculators (though they match the functionality here!): our Stock Correlation Calculator for equity analysis, an ETF Correlation Calculator for exchange-traded fund comparisons, and the Mutual Fund Correlation Calculator for fund portfolio optimization.
How to use the correlation calculator
To begin, select at least two securities and specify a date range. The tool will calculate correlations based on daily return data and give you the input you need for your comprehensive portfolio analysis.
Basic correlation inputs and security selection
The correlation calculator interface provides intuitive controls for portfolio analysis:
- Security Types: Choose between Stocks, ETFs, and Mutual Funds - or combine multiple types for comprehensive analysis
- Ticker Input: Enter valid security tickers (e.g., AAPL, SPY, VTSAX) across security types. As a shortcut, you can paste comma separated or newline separated lists of tickers (up to 10) to auto-populate the field. The tool also provides intelligent autocomplete, and (bonus) smart suggestions for stocks based on NAICS codes
- Date Range: Select your analysis period with convenient presets (YTD, 1Y, 2Y, 5Y) or your choice of custom dates. The tool will allow you to manually set a window of up to ten years
- Maximum Securities: Analyze up to 10 securities simultaneously for complex portfolio correlation analysis
If you add an individual stock to your analysis, the tool includes intelligent suggestions based on industry classifications (NAICS/SIC codes). When you add securities, the calculator identifies related companies in the same industry for enhanced portfolio analysis. When the tool has smart suggestions, you'll see a lightbulb icon next to the Add button. Hit the lightbulb to select related securities.
- Industry Analysis: Automatically suggests securities in the same NAICS industry group – or multiple groups for multiple tickers
- Sector Diversification: Identify potential portfolio overlaps and diversification opportunities
- Smart Filtering: Suggestions adapt based on your current security selection and NAICS codes
Interpreting correlation results and statistics
The correlation calculator provides two main result views: a correlation matrix and detailed statistics.
- Correlation Matrix: Interactive table showing pairwise correlations between all selected securities (-1.0 to +1.0)
- Market Relationship Metrics: Average correlation, correlation range, and most/least correlated pairs
- Stability Analysis: Identifies which security pairs have the most stable vs. volatile correlation relationships over time
- Visual Tooltips: Hover over correlation values to see 30-day rolling correlation charts and relationship descriptions
Understanding correlation values
Correlation values range from -1.0 to +1.0 and indicate how securities move relative to each other:
- +1.0: Perfect positive correlation - securities move together identically
- +0.5 to +0.8 (and up): Strong positive correlation - securities often move in the same direction
- 0.0: No correlation - securities move independently
- -0.5 to -0.8 (and down): Strong negative correlation - securities often move in opposite directions
- -1.0: Perfect negative correlation - securities move in exactly opposite directions
The correlation calculator helps you optimize portfolio construction by identifying securities that move independently (or together, depending on your goals here!). Lower correlations between holdings can reduce overall portfolio volatility while maintaining return potential.
You can use the tool to avoid concentration risk – at least, based on past relationships. Securities with correlations above 0.8 may provide less diversification benefit than expected. Conversely, securities with correlations below 0.3 can provide diversification opportunities.
Exporting and sharing correlation data
The tool includes export functionality to save your correlation analysis for future reference or portfolio management software integration. Exported data includes the full correlation matrix, summary statistics, and date range information. Hit the Export button to download a CSV with your results.
Source and methodology of the correlation calculator
The tool uses the Tiingo API for comprehensive security data. We have implemented reasonable usage limits:
- Security data may be up to 7 days old.
- There are rate limits in place for usage:
- Maximum 50 correlation calculations per day
- Maximum 10 calculations per minute
- Maximum 10 securities per correlation analysis
- Maximum 10 years date range to ensure reasonable processing time
Correlation calculation methodology
Correlations are calculated using daily return data based on adjusted closing prices. The tool:
- Calculates daily percentage returns for each security
- Aligns data to common trading dates across all selected securities
- Computes the Pearson correlation coefficients between return series
- Generates stability metrics based on rolling correlation windows
Limitations and disclaimers
Correlation analysis is based on historical data and past correlations do not guarantee future relationships.
The tool is for informational and research purposes only. We cannot warrant the results. Verify any information from this tool independently.
Correlation relationships can change rapidly during market stress, economic shifts, or company-specific events – as folks sometimes say, "everything tends to fall together".
We do not account for corporate actions, stock splits occurring after or before data updates, or other events that might affect correlation calculations. The analysis assumes securities trade on the same market hours and does not adjust for trading calendars.
Bug reports, feature requests, and support
Contact us if you find calculation errors or data issues. Include the specific tickers and date range that caused problems so we can investigate, and possibly pass information back to our provider.
For feature requests, remember this tool is maintained as a free, ad-supported service. Significant feature requests require consulting arrangements. But I'm happy to hear you out if you have ideas, please send them in.
We cannot provide investment advice or portfolio recommendations. This information is strictly for educational and research purposes. We will not respond to requests for investment guidance or portfolio optimization advice.
Specialized correlation calculators
For focused analysis, try our instrument-specific correlation calculators:
- Stock Correlation Calculator - Analyze equity correlations for stock portfolio optimization
- ETF Correlation Calculator - Compare exchange-traded funds to reduce portfolio overlap
- Mutual Fund Correlation Calculator - Optimize mutual fund portfolio diversification
- Cryptocurrency Correlation Calculator - See how cryptocurrencies move together
Correlation analysis and portfolio construction
We built this correlation calculator to address a fundamental challenge in portfolio construction: understanding how securities move together, not just how we think securities should move together.
Too many investors build portfolios based on asset class labels or industry groups without even considering past correlations. A "diversified" portfolio of large-cap growth stocks might have correlations above 0.9 - providing little actual diversification. Or, that super expensive, well-marketed ETF might be a shadow index of a cheaper fund, (or worse – it might capture the downside of an index and a fraction of the upside).
Compare your results with our other portfolio analysis tools:
- Stock Drawdown Calculator - Analyze maximum losses and volatility
- Stock Return Calculator - See stock total returns including dividend reinvestment
- ETF Return Calculator - Calculate total returns with dividend reinvestment
- Mutual Fund Return Calculator - Analyze fund performance over time
- Investment Calculator - Model future portfolio scenarios
Correlation is not causation (But it might matter)
Remember the classic warning: "correlation does not imply causation". Securities can be highly correlated – statistically – for all sorts of reasons that don't necessarily reflect something about their business relationship.
For portfolio construction purposes, though, correlation relationships matter more than correlation causes. Whether Apple and Microsoft move together because they're both technology stocks or because institutional investors treat them similarly, the portfolio impact is the same.
Use this tool to move beyond portfolio construction based on sector labels or market capitalization. Focus on actual return relationships to build truly diversified portfolios that can weather various market conditions.
We hope the correlation calculator helps you build better-diversified portfolios. Remember: the goal isn't necessarily to find uncorrelated assets - it's to understand the past relationships between your holdings.
