
Try our ETF correlation calculator which analyzes daily return correlations between exchange-traded funds. Use the tool to identify overlapping fund exposures, optimize your ETF allocation, and avoid concentration in your fund-based investment strategy.
Our database includes over 3,000 exchange-traded funds covering domestic and international markets, sectors, factors, and asset classes.
ETF correlation calculator for fund portfolio optimization
Need a broader analysis? Check out our comprehensive Security Correlation Calculator for stocks, ETFs, and mutual funds combined. Or, pare things back with our focused Stock Correlation Calculator and Mutual Fund Correlation Calculator.
How to analyze ETF correlations
Begin by entering at least two ETF symbols and selecting your analysis timeframe. The calculator will process correlations using daily return data to help you understand fund relationship dynamics and identify any portfolio overlap.
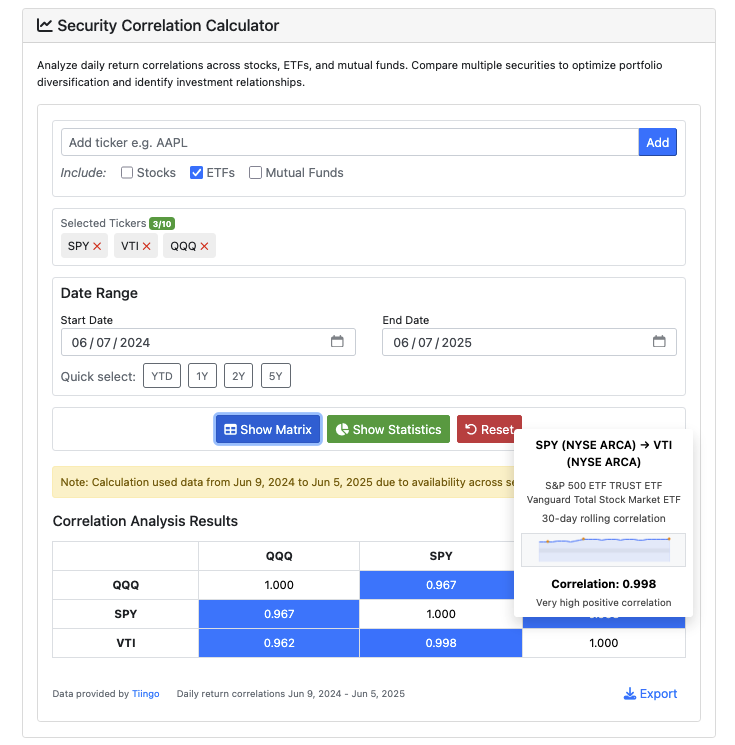
ETF selection and analysis setup
The ETF correlation interface is designed for efficient fund analysis:
- ETF Symbols: Enter valid ETF tickers (e.g., SPY, VTI, QQQ) for any exchange-traded fund. Bulk input is supported: paste multiple symbols separated by commas or line breaks (up to 10) to speed things up
- Analysis Timeframe: Select from convenient presets (YTD, 1Y, 2Y, 5Y) or choose custom date ranges extending up to 10 years
- Fund Comparison: Compare up to 10 ETFs to understand correlation patterns across your portfolio
Understanding ETF correlation results
The calculator displays results through two complementary views: an interactive correlation matrix and detailed statistical analysis.
- ETF Correlation Matrix: Displays pairwise correlations between all selected funds with intuitive color-coding to identify potential overlap issues
- Portfolio Overlap Metrics: Calculates average correlation levels, identifies the most and least correlated ETF pairs, and measures correlation distribution
- Relationship Consistency: Identifies which ETF pairs maintain stable correlations (and those with changing relationship dynamics)
- Trend Visualization: Hover over correlation values to access rolling correlation charts and relationship strength interpretations
Interpreting ETF correlation values
ETF correlations reveal how fund returns move relative to each other during your selected period:
- +0.8 to +1.0: Extremely high correlation - funds likely track similar indices or markets (read: potential redundancy)
- +0.6 to +0.8: High correlation - funds probably share significant overlap in holdings or factors
- +0.3 to +0.6: Moderate correlation - likely some shared factors but meaningful differences
- -0.3 to +0.3: Low correlation - funds provided good diversification benefits historically
- Below -0.3: Negative correlation - funds tend to move in opposite directions
Saving ETF correlation analysis
Export your ETF correlation results by clicking the Export button. The CSV includes the complete correlation matrix, summary statistics, and analysis for yoru detailed review.
ETF correlation data and methodology
These ETF correlation calculations use the Tiingo API with these constraints:
- ETF price data is updated within 7 days of market close
- Fair usage limits for system performance:
- 50 correlation analyses per day
- 10 analyses per minute
- Maximum 10 ETFs per correlation analysis
- Historical analysis is limited to 10-year maximum timeframes
ETF correlation computation methodology
My ETF correlation analysis tool follows (as far as I know...) industry-standard practices for fund comparison:
- Calculates daily percentage returns for each ETF
- Synchronizes data and returns to overlapping trading dates across all selected funds (don't worry, it reports timeframes below the analysis)
- Computes Pearson correlation coefficients between ETF return series
- Analyzes correlation stability using rolling windows to identify relationship changes over time
ETF analysis limitations and considerations
ETF correlations reflect historical relationships and past correlations cannot guarantee future fund relationships.
This calculator serves educational and research purposes only. Results do not constitute investment advice and require independent verification before making fund allocation decisions.
ETF correlations can shift dramatically due to changes in underlying holdings, index methodology modifications, or market regime changes. My tool's analysis does not account for tracking errors, or fund-specific events that may affect relative performance.
Technical support and feature suggestions
Contact us if you encounter calculation errors or unexpected results. Include the specific ETF symbols and date range that produced issues.
I welcome suggestions for improving the ETF correlation calculator. But, keep in mind this is a free, ad-supported service. Significant feature additions may require consulting engagements. Your feedback helps me enhance the tool for all users, though, so if you have a broadly applicable suggestion I might add it.
We cannot provide ETF recommendations, portfolio allocation advice, or fund selection guidance. This tool is intended for educational research purposes only.
Additional correlation analysis tools
Enhance your portfolio analysis with our related calculators:
- Security Correlation Calculator - Combined analysis of stocks, ETFs, and mutual funds
- Stock Correlation Calculator - Individual equity correlation analysis
- Mutual Fund Correlation Calculator - Dedicated mutual fund correlation analysis
- Cryptocurrency Correlation Calculator - See how cryptocurrencies move together
ETF correlation in modern portfolio theory
ETF correlation analysis is fundamental to efficient portfolio construction.
Consider that many sector ETFs, despite tracking different industries, may show high correlations during certain market periods due to shared sensitivity to factors like interest rates, economic growth, or investor sentiment. Similarly, international ETFs may become highly correlated with domestic funds during global market stress.
Supplement your ETF correlation analysis with these portfolio evaluation tools:
- ETF Return Calculator - Analyze historical performance with dividend reinvestment
- ETF Drawdown Calculator - Evaluate maximum past loss and volatility
- ETF Daily Moving Average Calculator - See ETF DMAs and trends
- Investment Calculator - Project future portfolio scenarios and outcomes
Avoiding ETF overlap and redundancy
While ETFs were designed to provide instant diversification, many investors inadvertently create concentrated portfolios by combining funds with high correlations. Understanding these relationships helps you build portfolios that truly capture different return drivers... rather than expensive duplications of the same market exposures.
