
Although you folks know we use Robert Shiller's data for quite a few of our articles, we're going to continue down that path for some time longer. Since we told you recently (in a 5 part series) that we aren't entirely thrilled with the market's valuation, we're producing this research to mollify our own concerns as much as to show interesting relationships. First up? Earnings versus index price.
10 Year Trailing Returns and Earnings Growth
Today's target? Growth on the S&P 500... and growth in S&P 500 earnings, which is an entirely different animal. Unlike the normal fare which went into our S&P 500 Calculator, this data is stripped of dividends and inflation. We're purely focused on earnings here; sure, inflation may mess around at the margins... but dividends are a choice by a company to pay out of their cash flow. If companies choose not to reinvest that money? Well, who are we to stop them?
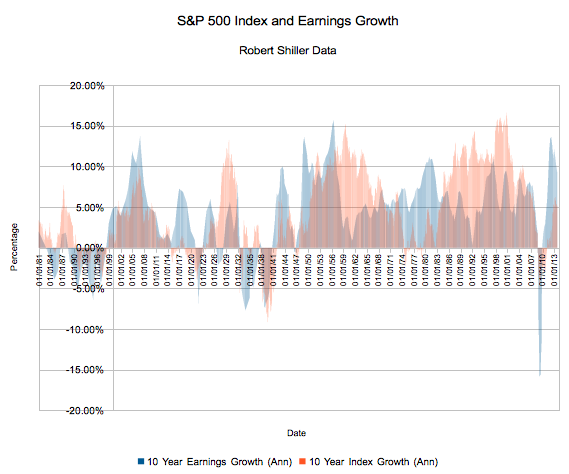
Here's what we've got on the 10 year trailing earnings and trailing index price growth front:
We picked the 10 year time-frame because, well, it already won a Nobel Prize. Additionally, we're of the mind that markets eventually reflect economic conditions (at least of their constituents), even if they sometimes get a bit out of whack.
That data reflects earnings from January of 1881 through September of 2013 (3Q, 2013) since S&P releases reported index earnings quarterly. You can find that earnings data here when it becomes available.
Earnings and Index Data Summary
As is our custom, we've summarized the data here. Please read the caveats after:
| 10 Year Earnings Growth (Ann) | 10 Year Index Growth (Ann) | |
| 09/01/13 | 9.36% | 5.17% |
| Average | 3.98% | 4.49% |
| Standard Deviation | 4.86% | 5.11% |
| Maximum | 15.67% | 16.62% |
| Minimum | -15.82% | -9.14% |
Looking for caveats? Note that we're using percentages, not absolutes with some sort of moderating factor like price to earnings ratios. Percentages can be pretty nasty when you average them together... the so-called "law of small numbers" guarantees that (Earn $1 one quarter, $5 the next... what was the growth?).
Still, over 132 years we're bound to get more signal than noise. Pay particularly close attention to the earnings growth section... we're currently looking at 9.36% trailing ten year growth. This number can be artificially high, and, in fact, will be artificially high in 2018/2019 when the look-back period includes the Great Recession.
Anyway, there's one more set of data to chew on while other people concentrate on expanding margins. We'll try to burrow down deeper on this topic - consider this your first class.
