
This article contains an income percentile calculator which will calculate 2016 income percentiles for the United States, based on all individual earners. It originates from the March Current Population Survey, so data for comparison is all income you (or your friend) earned between January and December 2015.
We also have calculators which break income down by age: 2013 Income by Age • 2014 Income by Age • 2015 Income By Age. (Net worth by age is from 2013 survey data, and found here.)
Notes: The tool has a logarithmic scale by default, but you can turn it off with the included checkbox.
Who Are the 1% in America in 2016?
The 1% has generally means the top 1% of income earners in the United States. Our data allows us to provide one definition of the 1% based on individual earners. The top 1% of those in (or close to) the workforce means:
- There are roughly 1.65 million individual income earners in the 1%
- Earning over $288,000 (including all forms of income - salary, business, interest, etc.) would put an individual in the 1% in 2016 in America
And how about the .1%?
Near the top of the income charts, public microdata from the CPS is screened and topcoded. Our estimates near the top are a bit hazy. Working with what we have (but please, allow some error), we can state:
- Roughly 165,000 individuals make up the top .1% of income earners
- Earning over ~$1,100,000 would put you in the top .1% in America in 2016
But again, this is a rough cut. Earners at this level are even less likely to complete a survey, so there is a dearth of data at the highest end.
Note too that some definitions of the top 1% and .1% only count household income. We'll revisit with our household income article.
Source and Methodology on the Income Percentile Calculator for 2016
The University of Minnesota’s IPUMS-CPS project compiles all the data we use in this tool. The CPS is a joint survey from the Bureau of Labor Statistics and the Census Bureau. The data in the tool comes from the March Annual Social and Economic Supplement (ASEC). March is when many people are in the process of doing their taxes (or have recently finished), so the income estimates should be very good.
We use an expansive definition of what it means for people to have or want to have a job. In response to comments and complaints about selection bias in previous calculators, we are now using people who report working at least one hour a week in the previous year, report they worked in the last year, or report that they currently want a job. All of these groups make up the calculations in this tool, and the lowest percentiles are occupied by people who did no work in all of 2015. A future 2016 calculator will screen this demographic out for full time workers, but this tool includes the widest possible definition of workforce on DQYDJ.
A note on accuracy: CPS data is self-reported and introduces some inaccuracy compared to IRS reported income numbers. Additionally, before microdata is released to you and me it is topcoded. Very high income earners are easier to personally identify, so their responses might be stripped from the survey. This leaves a very slight downward bias to the data.
For our purposes, we can trust the results from the calculator.
What Do We See in This Year's Individual Income Data?
Our data is mostly comparable to last year, despite the minor methodology change explained above.
Here's the improvement or decline at every income decile versus last year's calculation:
| Percentile | 2015 | 2016 | Improvement/Decline |
| 10 | $10,000.00 | $9,516.00 | -4.84% |
| 20 | $17,000.00 | $17,000.00 | 0.00% |
| 30 | $23,438.00 | $24,000.00 | 2.40% |
| 40 | $30,000.00 | $30,003.00 | 0.01% |
| 50 | $36,628.00 | $37,848.00 | 3.33% |
| 60 | $45,025.00 | $46,025.00 | 2.22% |
| 70 | $56,000.00 | $58,000.00 | 3.57% |
| 80 | $72,150.00 | $75,000.00 | 3.95% |
| 90 | $101,680.00 | $104,982.00 | 3.25% |
The median worker is seeing a nice gain this year - a full 3 and a third percent over the 2015 data, or another $1,220 a year. That's significant when spread over the economy, and it's good to see some durable gains showing up in the economy.
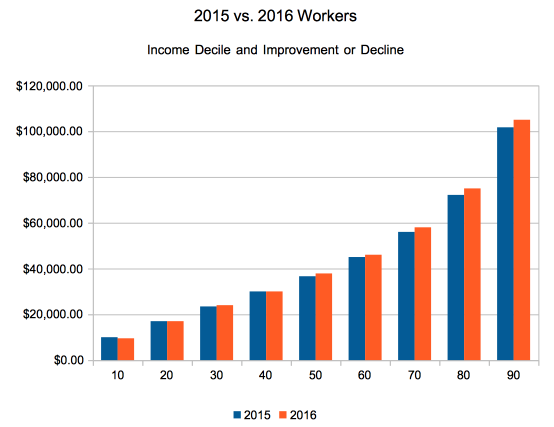
Note the decline in income in the 1st decile might be the methodology change introducing additional people, or it might be more people entering the workforce. It's impossible to say without further digging. Either way, that's a pretty wide-ranging improvement, and not just for the top 10%.
Past editions: 2014 Calculator, 2015 Calculator
See anything else in the income percentile calculator... either in isolation or compared to past calculators? Want to see us slice the numbers in a different way? What to see household income instead? Let us know what you think in the comments!
