
Every year – usually, conveniently, around tax time – we like to evaluate the total picture of our personal finances. DQYDJ is (at least occasionally) a personal finance web site, so that usually means an asset allocation post and a savings rate post. Today, I'll share our broad asset allocation snapshot.
If it helps with context, my wife and I are in our thirties and we have two kids.
Rolling Up My Asset Allocation in 2018
As with my asset allocation post last year, I am only sharing my allocation across liquid accounts we earmark for long-term saving or retirement. Roughly speaking, that means 'cash my wife I can access relatively quickly and assets we could easily liquidate'.
In this category, think: college savings, retirement and "dry powder". Don't think: real estate, cars, baseball cards, postage stamps, silverware, or whatever else goes into your total net worth. These are sources of cash and assets we can easily redeploy and aren't going to evaporate to pay our bills and day to day needs.
Investment Categories and Classes
Here's the current snapshot of our liquid long-term savings by investment category:
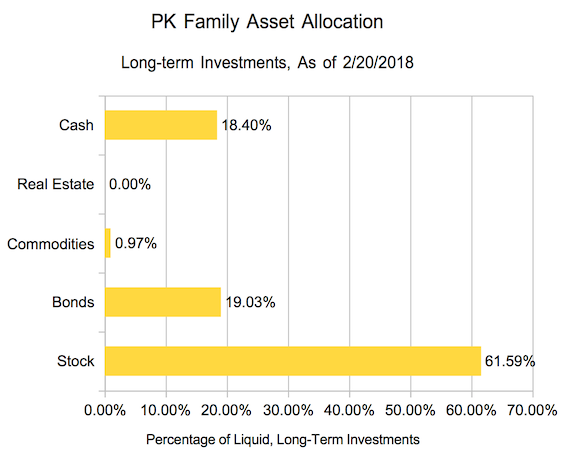
Long-term, Liquid Asset allocation in 2018 for the PK Family
You're looking at a bit of an awkward time here. The cash category contains a lot of that "dry powder".
Dry powder means having cash on hand to deploy into an investment idea. We're consolidating a number of orphaned accounts with Fidelity, and in the process sold out our previous holdings to cash. Although it looks like we're at a very conservative 62/38 risky/non-risky breakdown for our age, it's only because we haven't yet decided what to do with that cash.
The other notable change we've made year over year is taking our (liquid) real estate holdings to zero. Our commodities holdings are still a rounding error of our total portfolio at under one percent.
Foreign vs. Domestic Holdings
| By Country | Total |
| Domestic | 70.50% |
| Foreign | 29.50% |
Last year, we had a crazy skew of 81.16% domestic and 18.84% foreign holdings. We've brought that closer in-line to a 70/30 domestic - foreign split.
I'm not sure exactly where we'll end up after we reinvest, but 70% Domestic feels like a maximum.
Asset Allocation by Broad Category
| Holding | Percentage |
| Stocks | 61.59% |
| Commodities | 0.97% |
| Bonds & Cash | 37.43% |
To reiterate, a 37.43% bond and cash allocation is high for a couple in their thirties. One quick rule of thumb is to take 120 and subtract your age to find a 'risk' allocation that could work, then adjust it for your situation and lifestyle. I expect that cash will turn into more equities than bonds.
Management Style Breakdown - ex-Cash
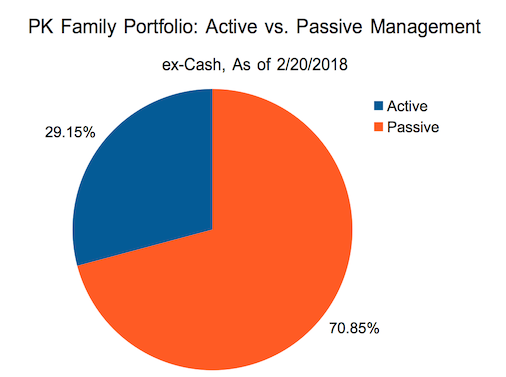
Active vs. Passive in 2018 - the Pie Chart is special for Cameron
In our previous entry, our allocation with active management was pretty high - more than half our portfolio at 53.44%. We've taken down the balance to a much healthier 29.15%. This category includes individual stock holdings, individual bonds, actively managed investments, and other similar assets.
Generically, we suggest passive management over active management. Passive investments usually track a broad index of stocks, bonds, or commodities instead of relying on managers to make investment moves.
Planning My 2018 Asset Allocation
Cash skews the ratios, but you can see the results of our moves after last year's post. We've reduced our active investments, sold out of liquid real estate funds, and decreased our ratio of foreign to domestic holdings. This year, we'll probably add even more foreign investments and put most of that cash into stock.
Hopefully this example helps you understand the process of taking a financial snapshot, planning, then (fingers crossed) executing.
This article pairs especially well with the post we just wrote on what to do in a stock market correction. Whatever asset allocation moves you make, plan them well in advance. A sober assessment of your finances is the way to go - not a panicky sell during a market drop.
What does your allocation look like in 2018? What moves are you planning to make?
