
Below is the the Ethereum Drawdown Calculator. This tool can help investors understand potential downside risks associated with an Ethereum investment by calculating the maximum drawdown and drawdown periods within their selected timeframe. You can either graph drawdowns, or display a drawdown period table.
Using the Ethereum drawdown calculator
To use this tool to analyze drawdowns in an Ethereum investment, set the following:
- Starting Date: Enter the date from when you want to start analyzing ETH drawdowns.
- Ending Date: Enter the date until when you want to analyze drawdowns.
- Calculate: Click the Calculate button to view the maximum drawdown and specific drawdown periods, and draw a graph of Ethereum's price along with an overlaid chart showing drawdowns from peak.
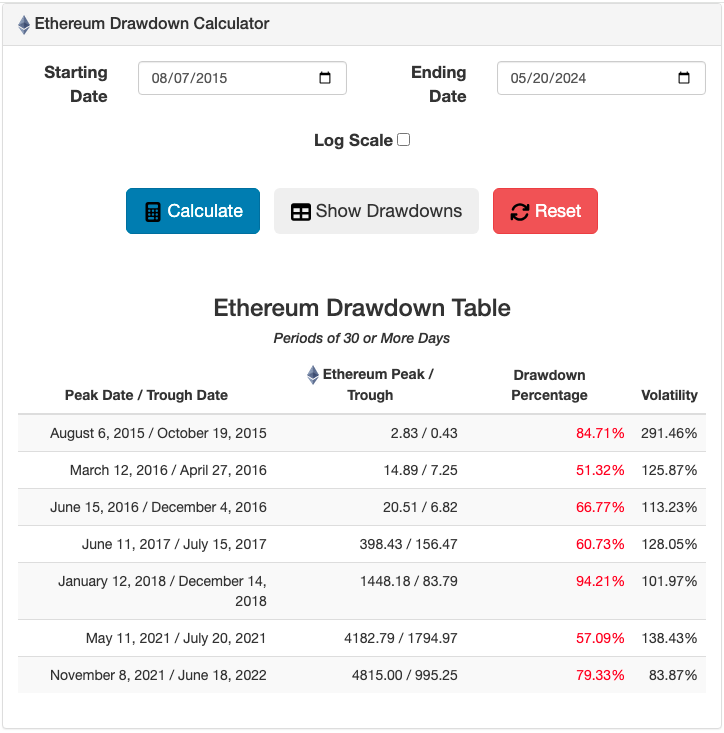
- Show Drawdowns: Click the Show Drawdowns button to display a detailed table of all significant drawdown periods.
It will include Ethereum's peak and trough value and date, the percentage drawdown between those dates, and the annualized daily volatility during that period. Note that it only shows drawdowns of 30 or more days.
Understanding drawdowns is important. They measure the drop from peak to bottom in the value of a portfolio, thus providing insights into the potential risk and volatility of Ethereum investments.
Special features
The Ethereum Drawdown Calculator offers a few unique features:
- Maximum Drawdown: Calculates the largest percentage drop in investment value over the specified period. You'll see this if you hit the Calculate button.
- Drawdown Periods: Identifies specific periods where 30+ day drawdowns occurred, helping you understand the duration, severity, and volatility of investment declines. This is a feature of the Show Drawdowns button.
- Volatility: Computes the annualized volatility based on daily log Ethereum returns during the drawdown periods in the table.
- Interactive Graphs: Visualize drawdown dynamics with interactive charts that highlight drawdowns from the previous high at a date, along with the Ethereum value.
Methodology and data sources
The calculator uses historical price data for Ethereum from CoinGecko and from Ethereum Price History.
For after: I also built an Ethereum Investment Calculator, an Ethereum Daily Moving Average Calculator, an Ethereum to USD tool, and USD to Ethereum calculator with the same data.
Disclaimer
While we strive to provide accurate and up-to-date information, the results from this calculator are for informational purposes only and should not be considered financial advice. Past performance is not a guarantee of future returns. Always conduct your own research and consult with a financial advisor before making investment decisions.
We hope this tool aids you in making informed decisions about Ethereum investments. For more financial tools, check out our Investing category page.
