
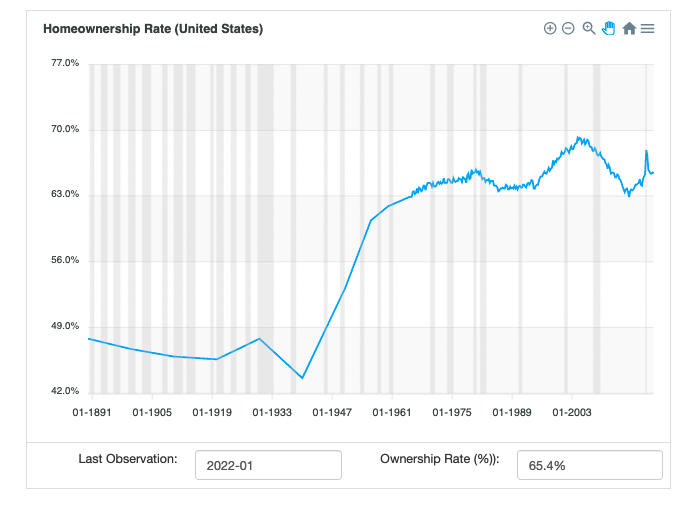
On this page, you'll find the historical homeownership rate for the United States. It contains data from 1890 until the present, with decade resolution in the beginning up to quarterly resolution at present.
Historical Homeownership Rate in the United States
Using the Historical Homeownership Tool
While the interactive chart is the main feature of the tool, it has a few more features for you to use.
- Zoom - Use the plus and minus buttons to zoom into a date range or to zoom out for an overview of homeownership during a period.
- Magnify - Use the magnifying glass mode to allow you to drag a window onto the chart to zoom to the desired period.
- Drag - Use the hand icon to drag dates to past or future when you are currently zoomed in to a date range
- Export - Use the hamburger menu to export the chart data for your own usage. You can export the graph to svg or png format, or export all data to a csv.
United States Homeownership Rate Sources
Homeownership data comes from the US Census Bureau's quarterly homeownership series, accessed from the St. Louis Federal Reserve's FRED API. Observations before 1965 I manually retrieved from (scanned) paper censuses.
Recession dates (the grey bars in the zoomable graph) come from the National Bureau of Economic Research.
This tool automatically updates for future releases and lags a quarter behind (due to the US Census Bureau's release timing.)
Homeownership in the United States
The United States has, for better or worse, increased its overall homeownership rate significantly from the turn of the 20th century. That's on top of a rapidly increasing population, an ever-increasing home price, and an unstable home affordability metric.
Some of that is credit to innovations around the 30-year fixed mortgage and mortgage insurance. Although more exotic products – including the widely available adjustable-rate mortgage (more common in other countries) – have been popular at times, fixed mortgages are the more common product. Fixed mortgages and fair tax rates ensure people can stay in their homes even when home affordability measures show homes are harder to get since there's no requirement to buy a new home or refinance.
Although homeownership varies by state (and even metro area), households looking to own homes are still generally able to make that happen in America.
