
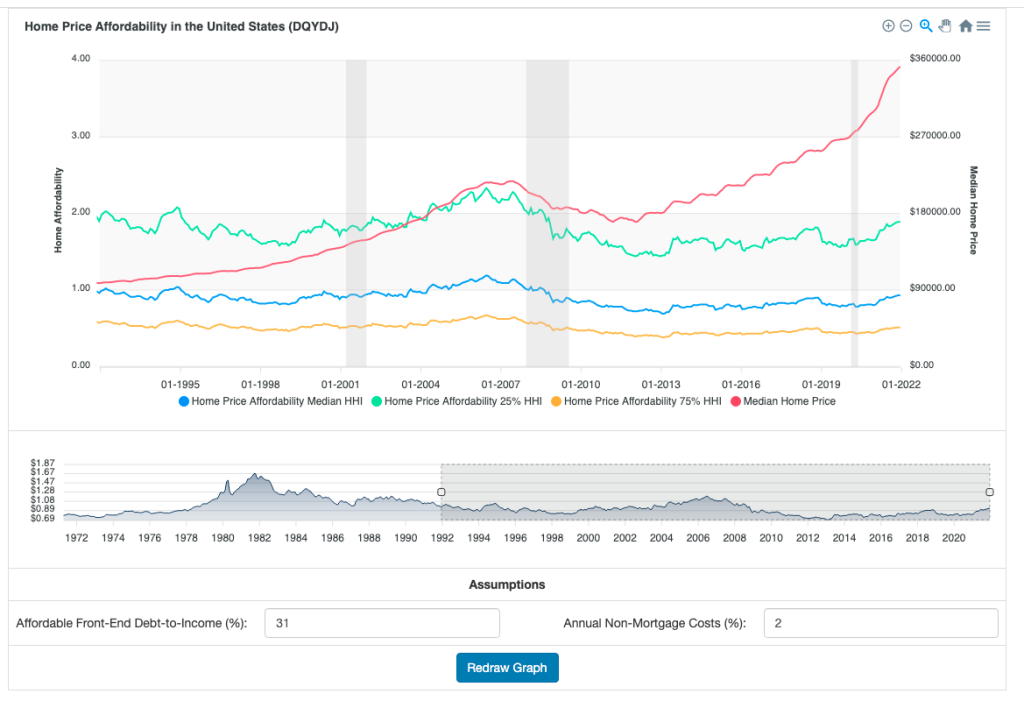
On this page is a home price affordability history tool for the United States. It contains data from 1971 on, and automatically updates monthly to show home price affordability for the median household income in the US. It also shows affordability for the 25th percentile and 75th percentile of household incomes.
This tool uses the historical median home price for single-family homes in the United States, historical 30-year fixed mortgage rates, and estimated non-mortgage costs to figure out a monthly payment on a median home. Then, using historical household income, it graphs the history of median home affordability at various income percentiles.
Home Price Affordability History Tool
In the tool, a larger number means less affordable. An affordability ratio of 1 or lower means median-priced homes are affordable for that income bracket.
Home Price Affordability
While home prices get the most attention, home affordability is the more important concept.
In an era of falling mortgage rates, more expensive houses are in reach due to lower monthly payments. Add to that rising incomes over time, and counterintuitively, rising home prices can happen while homes become more affordable.
That confluence of factors happened during the 2011-late 2020 US housing market. Although home prices rose, lower rates and higher household incomes made the median home affordable to the median earning household. And though effects were distributed (and many younger workers were still priced out of homes near their jobs), generally median home prices tracked what the median household could afford in monthly payments.
Limitations of the Home Price Affordability Metric
Although this tool can give you a historical snapshot of theoretical median, 25th percentile, and 75th percentile income buyers in the United States, it isn't the sharpest resolution. As you well know, different areas of the country have different home prices... and you definitely can't buy median-priced US homes in a large portion of the country!
(And I'm not even addressing the other significant cost in a home purchase – the down payment, traditionally 20% of the home price. Nor am I addressing the number of houses on the market.)
As the saying goes, "all real estate is local." Or: "location, location, location."
The tool only shows aggregate affordability in conditions where there is perfect mobility across the United States. And aggregate measures can be useful, but they don't necessarily accurately reflect the reality on the ground.
Even with more and more remote roles, perfect mobility isn't a good assumption – as you know, people decide where to live for other reasons than whether an area has high-speed internet. So you'd want to look at income at the city – or at least state – level, along with local real estate prices, to know how affordable an area might be.
Home Price Affordability Tool Methodology
By default, this tool assumes that an "affordable" front-end debt to income ratio (monthly cost as a percentage of a household's gross income) is 31%. 31% matches the US's Department of Housing and Urban Development [PDF] guidance.
The tool assumes that non-mortgage costs sum to 2% of a house's annual price as a best guess of non-mortgage costs, to match my experience. This also matches Bill McBride's estimate in his affordability index. I know: it's also probably wrong in your local market – plenty of areas have real estate taxes over 2%.
HUD lists the following costs as part of their calculation of monthly housing costs:
- principal and interest
- escrow deposits for real estate taxes
- hazard insurance
- mortgage insurance premium
- homeowners' association dues
- ground rent
- special assessments, and
- payments for any acceptable secondary financing
Don't worry – you can change the assumptions on front-end debt to income ratio and non-mortgage costs. Just hit the "Redraw Graph" button if you change any inputs.
The tool assumes a 20% down payment to match the conforming loan minimum in the United States. It uses Freddie Mac's 30 year fixed mortgage rate series as a mortgage rate estimate.
Home prices and past household income statistics are calculated on their own pages on the site:
You can export the three affordability series using the hamburger menu in the upper right corner of the upper graph. Choose to export to PNG or SVG for the graphic, or export to CSV to work on the numbers elsewhere. And don';t forget to overlay homeownership rates – that tool also allows you to export the series over time.
Enjoy the tool!
