
On this page is the United States average household income by year and median household income by year between 1968 and 2026. You'll also find the top 1% household income by year between 1996 and 2026, plus the top 5% and 10% for the full range. Finally, I've included a household income by year calculator for you to compare household income centile rank for each year in the set.
Afterwards, see this year's snapshot in the United States average income, median income, and income percentile post. Alternatively, see individual income by year.
Household income percentile by year calculator
Note: incomes are earned in the calendar year before the survey year – so 2026 numbers here are income earned in 2025. Other sources label it by the year the income was earned. See the methodology below for notes about inflation adjustments.
Household income percentile statistics from 1968-2026
Below I've included summary statistics of average income by year and median income by year in the United States. Also, I've done the math for top 10%, top 5%, and top 1% incomes.
The top 1% is a bit hazy because of top-coding (see my notes, below), but the other data should be useful in comparisons. Enjoy!
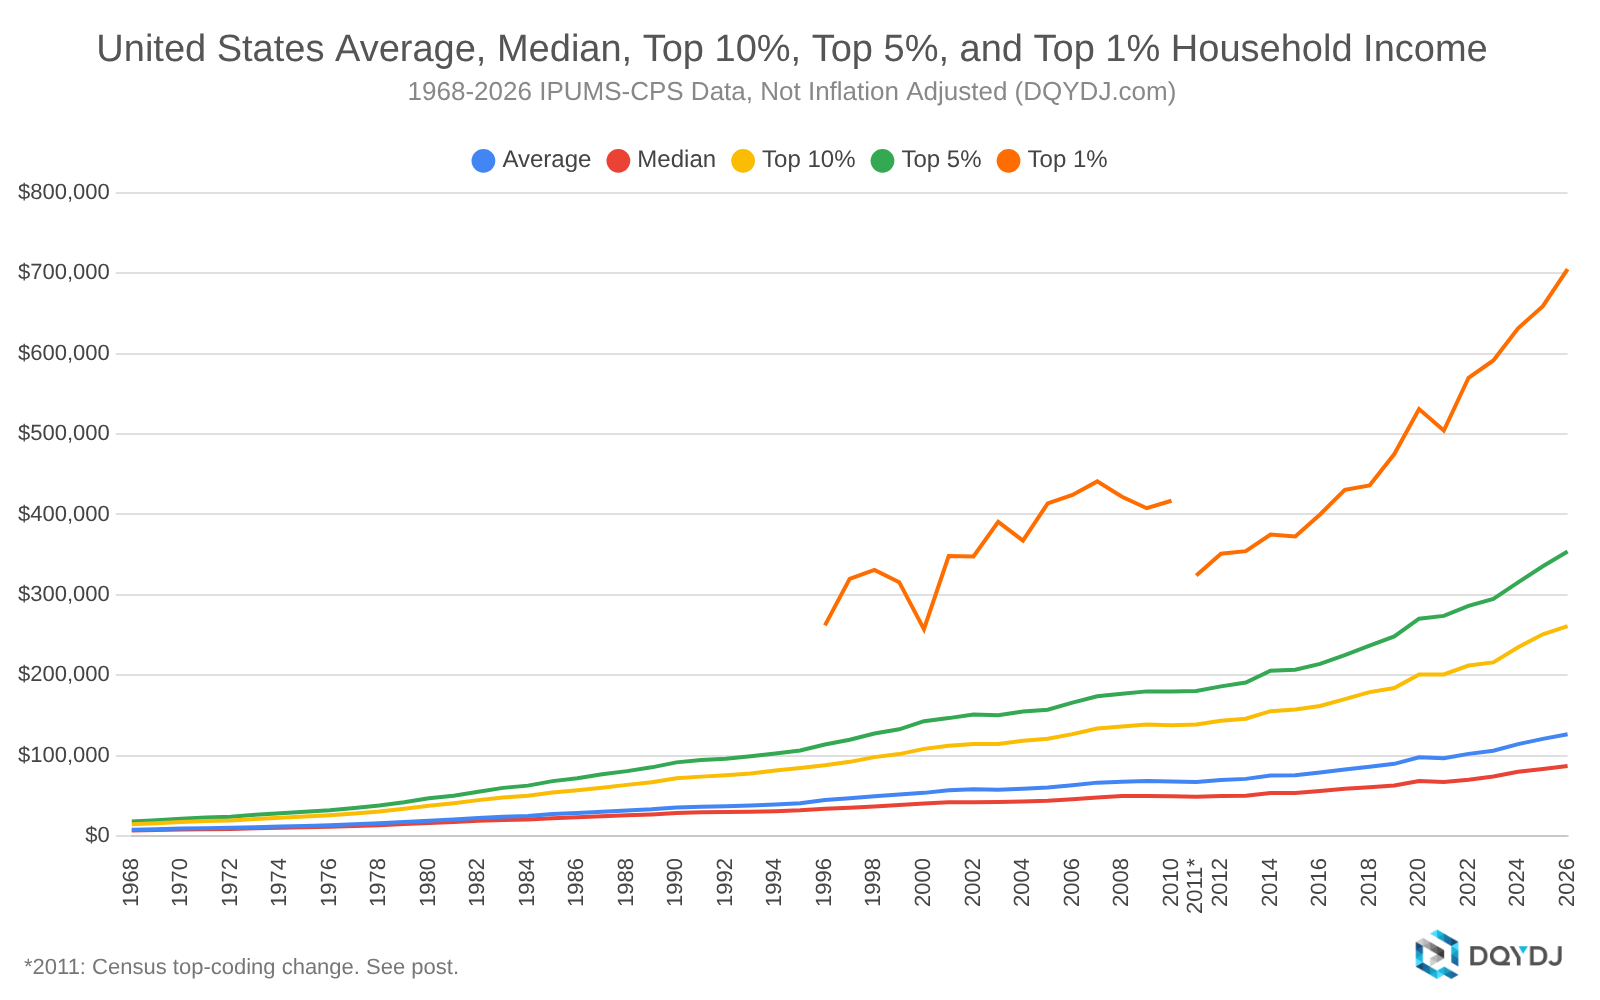
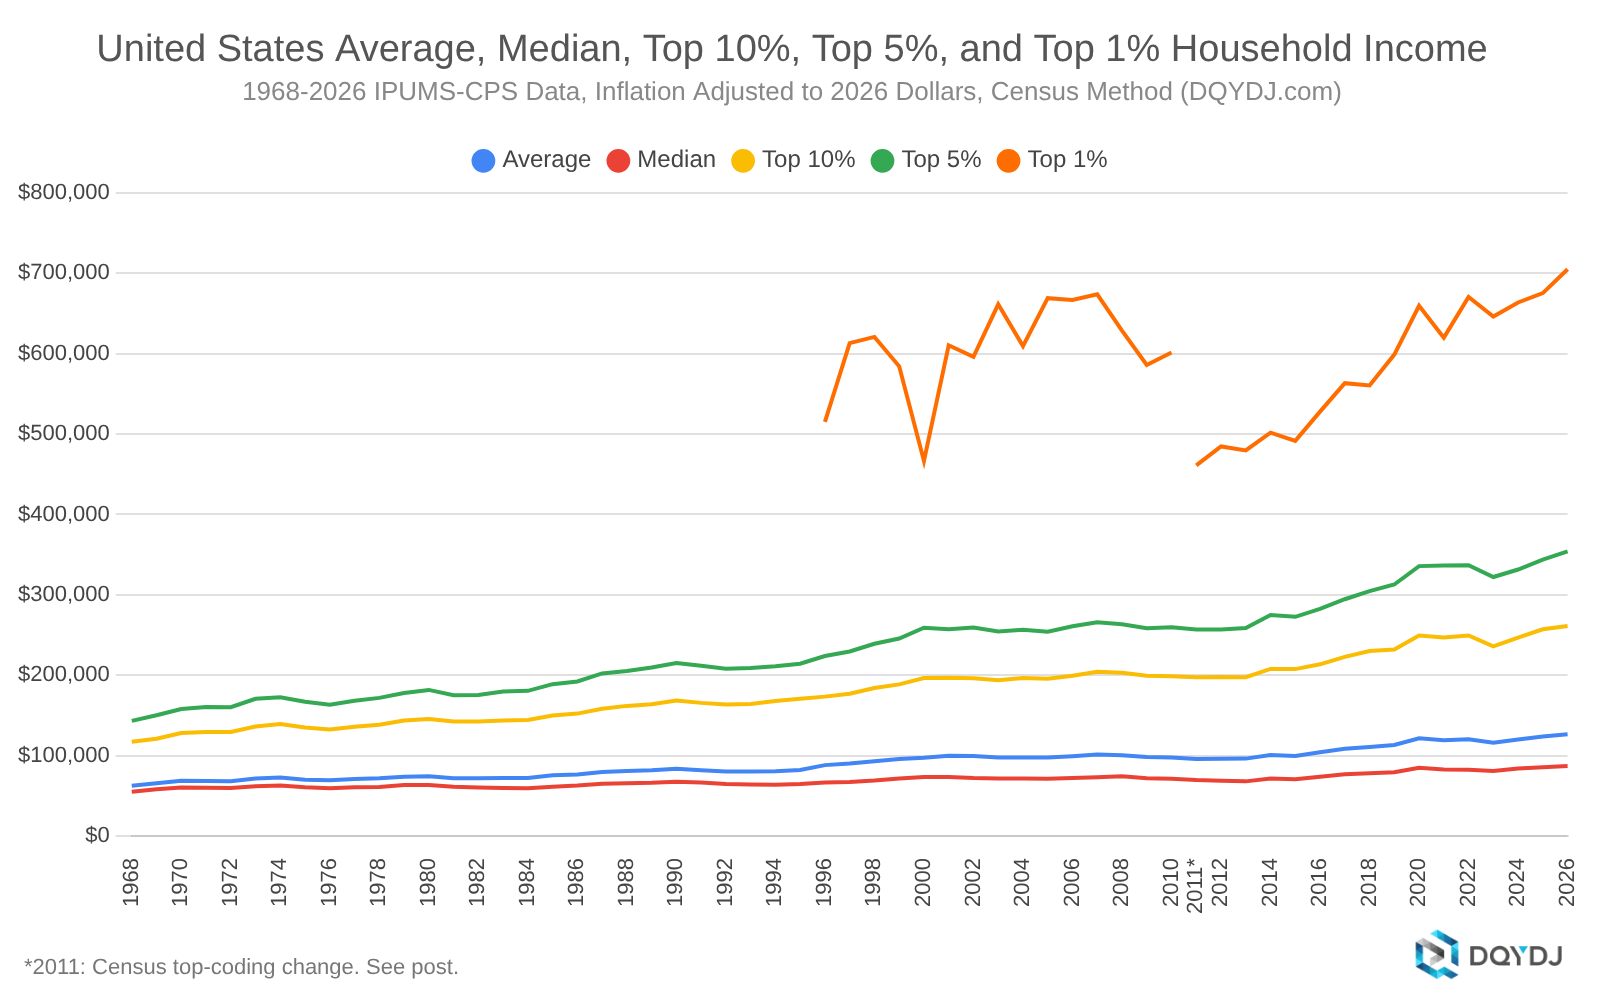
Median household income by year
This table shows the median household income per year in the United States, including both inflation-adjusted and nominal amounts.
| Year | Median (nominal) | CPI-U (2026 $) | Census (2026 $) |
| 1968 | $7,005 | $67,668 | $55,149 |
| 1969 | $7,683 | $71,022 | $58,172 |
| 1970 | $8,330 | $73,153 | $60,521 |
| 1971 | $8,700 | $72,139 | $60,241 |
| 1972 | $9,000 | $71,556 | $59,797 |
| 1973 | $9,648 | $74,263 | $62,016 |
| 1974 | $10,378 | $75,095 | $62,872 |
| 1975 | $11,000 | $71,797 | $60,673 |
| 1976 | $11,700 | $69,983 | $59,577 |
| 1977 | $12,604 | $71,202 | $60,710 |
| 1978 | $13,500 | $71,654 | $61,076 |
| 1979 | $15,000 | $74,118 | $63,508 |
| 1980 | $16,400 | $72,672 | $63,446 |
| 1981 | $17,666 | $68,951 | $61,550 |
| 1982 | $19,000 | $67,231 | $60,417 |
| 1983 | $20,000 | $66,736 | $59,964 |
| 1984 | $20,687 | $66,835 | $59,527 |
| 1985 | $22,260 | $68,920 | $61,485 |
| 1986 | $23,530 | $70,371 | $62,847 |
| 1987 | $24,744 | $72,653 | $65,015 |
| 1988 | $25,900 | $73,371 | $65,829 |
| 1989 | $27,050 | $73,606 | $66,301 |
| 1990 | $28,838 | $74,886 | $67,707 |
| 1991 | $29,834 | $73,426 | $66,807 |
| 1992 | $30,000 | $70,856 | $64,818 |
| 1993 | $30,439 | $69,843 | $64,143 |
| 1994 | $31,000 | $69,080 | $63,761 |
| 1995 | $32,140 | $69,769 | $64,688 |
| 1996 | $34,000 | $71,790 | $66,833 |
| 1997 | $35,172 | $72,136 | $67,383 |
| 1998 | $36,928 | $74,086 | $69,237 |
| 1999 | $38,816 | $76,679 | $71,803 |
| 2000 | $40,551 | $78,345 | $73,499 |
| 2001 | $42,000 | $78,476 | $73,591 |
| 2002 | $42,125 | $76,562 | $72,186 |
| 2003 | $42,381 | $75,815 | $71,715 |
| 2004 | $43,160 | $75,530 | $71,553 |
| 2005 | $44,097 | $75,128 | $71,296 |
| 2006 | $46,001 | $75,831 | $72,293 |
| 2007 | $48,020 | $76,673 | $73,348 |
| 2008 | $50,000 | $77,590 | $74,460 |
| 2009 | $50,000 | $74,768 | $71,834 |
| 2010 | $49,578 | $74,425 | $71,502 |
| 2011 | $49,100 | $72,468 | $69,861 |
| 2012 | $50,000 | $71,556 | $69,000 |
| 2013 | $50,306 | $70,582 | $68,096 |
| 2014 | $53,568 | $73,977 | $71,660 |
| 2015 | $53,600 | $72,926 | $70,680 |
| 2016 | $56,025 | $76,065 | $73,929 |
| 2017 | $58,849 | $78,956 | $76,982 |
| 2018 | $60,810 | $79,867 | $78,177 |
| 2019 | $63,030 | $80,806 | $79,434 |
| 2020 | $68,400 | $86,090 | $84,947 |
| 2021 | $67,463 | $83,927 | $82,910 |
| 2022 | $70,181 | $83,388 | $82,564 |
| 2023 | $74,202 | $81,593 | $81,049 |
| 2024 | $80,020 | $84,526 | $84,092 |
| 2025 | $83,592 | $85,767 | $85,653 |
| 2026 | $87,288 | $87,288 | $87,288 |
Average household income by year
In this table is the average household income per year in the United States, including both inflation-adjusted and nominal numbers.
Note: due to the aggressive top-coding for 1995 and earlier, the average will be slightly low. See the methodology for more.
| Year | Average (nominal) | CPI-U (2026 $) | Census (2026 $) |
| 1968 | $7,961 | $76,903 | $62,675 |
| 1969 | $8,672 | $80,164 | $65,660 |
| 1970 | $9,460 | $83,076 | $68,731 |
| 1971 | $9,918 | $82,239 | $68,675 |
| 1972 | $10,283 | $81,756 | $68,321 |
| 1973 | $11,140 | $85,747 | $71,607 |
| 1974 | $12,015 | $86,940 | $72,789 |
| 1975 | $12,727 | $83,069 | $70,199 |
| 1976 | $13,619 | $81,461 | $69,348 |
| 1977 | $14,733 | $83,229 | $70,965 |
| 1978 | $15,878 | $84,276 | $71,835 |
| 1979 | $17,441 | $86,179 | $73,843 |
| 1980 | $19,251 | $85,305 | $74,475 |
| 1981 | $20,676 | $80,699 | $72,037 |
| 1982 | $22,614 | $80,019 | $71,909 |
| 1983 | $24,078 | $80,343 | $72,191 |
| 1984 | $25,148 | $81,247 | $72,364 |
| 1985 | $27,388 | $84,797 | $75,649 |
| 1986 | $28,742 | $85,959 | $76,768 |
| 1987 | $30,314 | $89,007 | $79,650 |
| 1988 | $31,884 | $90,322 | $81,039 |
| 1989 | $33,392 | $90,864 | $81,845 |
| 1990 | $35,640 | $92,549 | $83,677 |
| 1991 | $36,575 | $90,016 | $81,902 |
| 1992 | $37,194 | $87,847 | $80,362 |
| 1993 | $38,109 | $87,443 | $80,306 |
| 1994 | $39,292 | $87,557 | $80,816 |
| 1995 | $40,846 | $88,668 | $82,210 |
| 1996 | $44,919 | $94,845 | $88,297 |
| 1997 | $47,110 | $96,621 | $90,254 |
| 1998 | $49,681 | $99,672 | $93,148 |
| 1999 | $51,813 | $102,355 | $95,846 |
| 2000 | $53,797 | $103,936 | $97,508 |
| 2001 | $57,113 | $106,714 | $100,072 |
| 2002 | $58,174 | $105,731 | $99,688 |
| 2003 | $57,819 | $103,432 | $97,838 |
| 2004 | $59,045 | $103,329 | $97,888 |
| 2005 | $60,432 | $102,958 | $97,706 |
| 2006 | $63,303 | $104,353 | $99,484 |
| 2007 | $66,531 | $106,230 | $101,622 |
| 2008 | $67,620 | $104,933 | $100,699 |
| 2009 | $68,409 | $102,296 | $98,283 |
| 2010 | $67,867 | $101,880 | $97,879 |
| 2011 | $67,366 | $99,428 | $95,850 |
| 2012 | $69,663 | $99,695 | $96,136 |
| 2013 | $71,201 | $99,899 | $96,380 |
| 2014 | $75,311 | $104,003 | $100,747 |
| 2015 | $75,665 | $102,947 | $99,776 |
| 2016 | $79,121 | $107,422 | $104,406 |
| 2017 | $82,957 | $111,301 | $108,519 |
| 2018 | $86,212 | $113,230 | $110,833 |
| 2019 | $89,931 | $115,293 | $113,336 |
| 2020 | $97,974 | $123,313 | $121,676 |
| 2021 | $96,955 | $120,616 | $119,155 |
| 2022 | $102,310 | $121,564 | $120,362 |
| 2023 | $106,271 | $116,856 | $116,077 |
| 2024 | $114,395 | $120,837 | $120,217 |
| 2025 | $120,952 | $124,100 | $123,935 |
| 2026 | $126,664 | $126,664 | $126,664 |
Top 10% household income by year
This table includes top 10% household income by year in the US. As with all these calculations, I've included both non inflation-adjusted and inflation-adjusted numbers.
| Year | Top 10% (nominal) | CPI-U (2026 $) | Census (2026 $) |
| 1968 | $14,920 | $144,127 | $117,462 |
| 1969 | $16,000 | $147,904 | $121,145 |
| 1970 | $17,636 | $154,876 | $128,133 |
| 1971 | $18,680 | $154,892 | $129,345 |
| 1972 | $19,500 | $155,037 | $129,559 |
| 1973 | $21,202 | $163,196 | $136,284 |
| 1974 | $23,000 | $166,427 | $139,338 |
| 1975 | $24,500 | $159,912 | $135,135 |
| 1976 | $26,050 | $155,816 | $132,648 |
| 1977 | $28,250 | $159,588 | $136,073 |
| 1978 | $30,600 | $162,415 | $138,440 |
| 1979 | $33,978 | $167,891 | $143,859 |
| 1980 | $37,645 | $166,812 | $145,635 |
| 1981 | $40,900 | $159,634 | $142,498 |
| 1982 | $44,784 | $158,466 | $142,406 |
| 1983 | $48,000 | $160,166 | $143,914 |
| 1984 | $50,200 | $162,185 | $144,452 |
| 1985 | $54,328 | $168,208 | $150,062 |
| 1986 | $57,052 | $170,626 | $152,382 |
| 1987 | $60,270 | $176,963 | $158,360 |
| 1988 | $63,726 | $180,526 | $161,970 |
| 1989 | $66,920 | $182,098 | $164,024 |
| 1990 | $71,846 | $186,568 | $168,682 |
| 1991 | $74,000 | $182,125 | $165,707 |
| 1992 | $75,766 | $178,949 | $163,701 |
| 1993 | $77,971 | $178,907 | $164,305 |
| 1994 | $81,670 | $181,991 | $167,980 |
| 1995 | $84,808 | $184,100 | $170,692 |
| 1996 | $88,250 | $186,338 | $173,472 |
| 1997 | $92,374 | $189,455 | $176,972 |
| 1998 | $98,262 | $197,136 | $184,233 |
| 1999 | $102,010 | $201,517 | $188,702 |
| 2000 | $108,487 | $209,597 | $196,635 |
| 2001 | $112,410 | $210,035 | $196,961 |
| 2002 | $114,504 | $208,111 | $196,215 |
| 2003 | $114,626 | $205,053 | $193,964 |
| 2004 | $118,662 | $207,658 | $196,725 |
| 2005 | $121,012 | $206,169 | $195,652 |
| 2006 | $126,838 | $209,088 | $199,334 |
| 2007 | $133,726 | $213,520 | $204,258 |
| 2008 | $136,435 | $211,721 | $203,178 |
| 2009 | $138,774 | $207,517 | $199,375 |
| 2010 | $137,912 | $207,029 | $198,899 |
| 2011 | $138,921 | $205,038 | $197,661 |
| 2012 | $143,489 | $205,349 | $198,016 |
| 2013 | $146,000 | $204,845 | $197,630 |
| 2014 | $155,426 | $214,641 | $207,920 |
| 2015 | $157,494 | $214,281 | $207,681 |
| 2016 | $161,915 | $219,831 | $213,660 |
| 2017 | $170,432 | $228,663 | $222,947 |
| 2018 | $179,077 | $235,198 | $230,220 |
| 2019 | $184,200 | $236,148 | $232,138 |
| 2020 | $200,968 | $252,945 | $249,586 |
| 2021 | $201,052 | $250,117 | $247,087 |
| 2022 | $212,110 | $252,027 | $249,535 |
| 2023 | $216,056 | $237,576 | $235,991 |
| 2024 | $234,769 | $247,990 | $246,716 |
| 2025 | $251,036 | $257,569 | $257,227 |
| 2026 | $261,248 | $261,248 | $261,248 |
Top 5% household income by year
Below I've listed the estimated top 5% household incomes per year in the United States. You'll find both inflation adjusted and nominal numbers.
| Year | Top 5% (nominal) | CPI-U (2026 $) | Census (2026 $) |
| 1968 | $18,200 | $175,812 | $143,285 |
| 1969 | $19,850 | $183,494 | $150,295 |
| 1970 | $21,762 | $191,110 | $158,110 |
| 1971 | $23,195 | $192,329 | $160,608 |
| 1972 | $24,138 | $191,912 | $160,374 |
| 1973 | $26,560 | $204,438 | $170,725 |
| 1974 | $28,510 | $206,297 | $172,719 |
| 1975 | $30,280 | $197,638 | $167,016 |
| 1976 | $32,100 | $192,004 | $163,454 |
| 1977 | $34,930 | $197,324 | $168,249 |
| 1978 | $38,000 | $201,692 | $171,919 |
| 1979 | $42,028 | $207,668 | $177,942 |
| 1980 | $47,000 | $208,266 | $181,826 |
| 1981 | $50,300 | $196,322 | $175,249 |
| 1982 | $55,196 | $195,309 | $175,514 |
| 1983 | $60,000 | $200,207 | $179,893 |
| 1984 | $62,800 | $202,892 | $180,708 |
| 1985 | $68,416 | $211,826 | $188,975 |
| 1986 | $72,000 | $215,331 | $192,308 |
| 1987 | $77,002 | $226,091 | $202,324 |
| 1988 | $80,814 | $228,934 | $205,403 |
| 1989 | $85,540 | $232,765 | $209,662 |
| 1990 | $91,713 | $238,158 | $215,327 |
| 1991 | $94,578 | $232,770 | $211,788 |
| 1992 | $96,299 | $227,445 | $208,065 |
| 1993 | $99,200 | $227,618 | $209,040 |
| 1994 | $102,734 | $228,930 | $211,304 |
| 1995 | $106,501 | $231,191 | $214,353 |
| 1996 | $113,940 | $240,582 | $223,971 |
| 1997 | $119,825 | $245,756 | $229,563 |
| 1998 | $127,590 | $255,975 | $239,221 |
| 1999 | $132,826 | $262,392 | $245,707 |
| 2000 | $142,986 | $276,249 | $259,165 |
| 2001 | $146,764 | $274,224 | $257,155 |
| 2002 | $151,354 | $275,086 | $259,362 |
| 2003 | $150,416 | $269,078 | $254,526 |
| 2004 | $154,846 | $270,980 | $256,713 |
| 2005 | $157,186 | $267,798 | $254,138 |
| 2006 | $166,000 | $273,645 | $260,879 |
| 2007 | $174,020 | $277,857 | $265,805 |
| 2008 | $176,993 | $274,659 | $263,576 |
| 2009 | $180,000 | $269,164 | $258,604 |
| 2010 | $180,000 | $270,210 | $259,600 |
| 2011 | $180,620 | $266,584 | $256,992 |
| 2012 | $186,256 | $266,553 | $257,035 |
| 2013 | $191,111 | $268,138 | $258,694 |
| 2014 | $205,590 | $283,917 | $275,026 |
| 2015 | $206,814 | $281,384 | $272,717 |
| 2016 | $214,125 | $290,716 | $282,555 |
| 2017 | $225,196 | $302,138 | $294,586 |
| 2018 | $237,034 | $311,319 | $304,729 |
| 2019 | $248,304 | $318,330 | $312,925 |
| 2020 | $270,358 | $340,281 | $335,763 |
| 2021 | $273,850 | $340,681 | $336,553 |
| 2022 | $286,301 | $340,181 | $336,816 |
| 2023 | $295,020 | $324,404 | $322,241 |
| 2024 | $315,504 | $333,272 | $331,560 |
| 2025 | $335,575 | $344,307 | $343,850 |
| 2026 | $354,000 | $354,000 | $354,000 |
Top 1% household income by year
Below are top 1% household incomes per year in the United States. I've included both nominal and inflation adjusted numbers. (Especially for the top 1% see the note on inflation).
See the note in the FAQ below regarding 1995 and earlier data, and 1996 - 2010 data.
| Year | Top 1% (nominal) | CPI-U (2026 $) | Census (2026 $) |
| 1996 | $262,042 | $553,295 | $515,093 |
| 1997 | $319,982 | $656,269 | $613,028 |
| 1998 | $331,103 | $664,269 | $620,792 |
| 1999 | $315,815 | $623,880 | $584,207 |
| 2000 | $257,449 | $497,391 | $466,631 |
| 2001 | $348,370 | $650,920 | $610,403 |
| 2002 | $347,788 | $632,104 | $595,973 |
| 2003 | $390,823 | $699,139 | $661,331 |
| 2004 | $367,590 | $643,282 | $609,413 |
| 2005 | $413,751 | $704,909 | $668,953 |
| 2006 | $424,189 | $699,260 | $666,638 |
| 2007 | $441,128 | $704,347 | $673,797 |
| 2008 | $422,076 | $654,981 | $628,551 |
| 2009 | $407,778 | $609,773 | $585,851 |
| 2010 | $417,011 | $626,003 | $601,422 |
| 2011 | $324,016 | $478,227 | $461,020 |
| 2012 | $351,167 | $502,559 | $484,614 |
| 2013 | $354,400 | $497,241 | $479,726 |
| 2014 | $375,003 | $517,874 | $501,657 |
| 2015 | $372,719 | $507,108 | $491,490 |
| 2016 | $400,034 | $543,124 | $527,877 |
| 2017 | $430,600 | $577,722 | $563,281 |
| 2018 | $435,986 | $572,621 | $560,499 |
| 2019 | $475,116 | $609,107 | $598,765 |
| 2020 | $531,020 | $668,359 | $659,484 |
| 2021 | $504,420 | $627,521 | $619,917 |
| 2022 | $570,003 | $677,273 | $670,574 |
| 2023 | $591,550 | $650,469 | $646,132 |
| 2024 | $631,500 | $667,063 | $663,637 |
| 2025 | $659,060 | $676,210 | $675,312 |
| 2026 | $704,999 | $704,999 | $704,999 |
Other household income by year questions
Why are the top percentiles not included for 1995 and earlier data?
The Census Bureau changed its top coding procedure for the 1996 survey, moving from hard top codes to replacement values. It's possible to estimate the top 1% for earlier dates with this survey, but it's a bit of work to reconstruct top ASEC household income and I haven't done it here... yet.
Arbitrarily, I chose the 95th percentile as the top percentile for earlier years. In theory, every percentile can be colored by the top coding, since different forms of income have different top codes. However, in practice, top codes happen more – and move the needle more – at the top.
Why is there a disconnect in top 1% data after 2010?
The top 1% series has a discontinuity from 2010-2011. The Census Bureau switched from replacing top-coded incomes with averages to rank proximity swapping, so treat 1996-2010 and 2011 onward as separate series.
What income is included?
Household income here is the IPUMS HHINCOME variable – total pre-tax money income in the prior calendar year for everyone in the household age 15 and up. That includes wages, business and farm income, Social Security, SSI, public assistance, pensions and retirement income, interest, dividends, rent, unemployment, workers' comp, veterans' benefits, and child support.
It does not include realized capital gains, noncash benefits (SNAP, housing assistance, Medicare/Medicaid, employer-paid health insurance), or refundable tax credits such as the Earned Income Tax Credit. Additionally, these numbers are not adjusted for taxes paid.
What other calculators do you have?
Want even more calculators and interactive tools?
To see how percentiles changed over time, see this tool. See our individual income calculator and research. Also, see our net worth calculator and net worth by age calculator.
Or, surf our calculator page.
Source and methodology on the household income by year data
Sarah Flood, Miriam King, Renae Rodgers, Steven Ruggles, J. Robert Warren, Daniel Backman, Etienne Breton, Grace Cooper, Julia A. Rivera Drew, Stephanie Richards, David Van Riper, and Kari C.W. Williams. IPUMS CPS: Version 13.0 [dataset]. Minneapolis, MN: IPUMS, 2025. https://doi.org/10.18128/D030.V13.0
See the household income bracket article for details on methodology. You can also alternatively reproduce these numbers through Berkeley's SDA.
Be sure to understand the effects of top coding in 1995 and earlier years (see the above question and links) – the SDA will show results, but you need to understand the circumstances. Additionally, there is a disconnect between 1996-2010 and later top 1% series which I explained above.
Inflation vs. household income by year
Each table has two inflation-adjusted columns: one uses the plain CPI-U, from the IPUMS CPI99 table (Table 1), and the second uses chained CPI-U from 2000 on, the R-CPI-U-RS from 1978 to 1999, and the CPI-U-X1 before that, the preferred adjustment methodology of the Census Bureau. The most recent year uses the preliminary chained CPI-U, so the Census Method numbers may shift slightly once the Bureau of Labor Statistics finalizes it.
Either column you scan, take the inflation estimates with a grain of salt. The bottom line: they are a reasonable adjustment for inflation over time. But – the further back you go, the fuzzier it gets...
Notes on data quality
Here is a summary of the number of data points in the income set by year, along with the estimated number of households after weighting.
Data points for a household include just the householder – if you don't filter for duplicates, you'll get the wrong numbers. On Berkeley's SDA you can use the filter PERNUM(1) to do this. (For stats packages you're on your own).
| Year | Number of Households | Data Points |
| 1968 | 60,444,691 | 46,528 |
| 1969 | 61,799,969 | 47,506 |
| 1970 | 62,847,603 | 45,424 |
| 1971 | 64,226,502 | 46,432 |
| 1972 | 66,669,452 | 45,408 |
| 1973 | 68,244,948 | 44,895 |
| 1974 | 69,849,077 | 44,846 |
| 1975 | 71,092,335 | 44,153 |
| 1976 | 73,190,096 | 46,368 |
| 1977 | 74,518,729 | 55,540 |
| 1978 | 76,351,711 | 54,762 |
| 1979 | 77,688,809 | 54,941 |
| 1980 | 79,399,013 | 65,238 |
| 1981 | 82,631,807 | 65,731 |
| 1982 | 83,793,123 | 59,276 |
| 1983 | 84,267,758 | 59,211 |
| 1984 | 85,809,226 | 59,171 |
| 1985 | 87,183,536 | 59,799 |
| 1986 | 88,811,402 | 58,935 |
| 1987 | 89,864,336 | 58,279 |
| 1988 | 91,434,838 | 58,975 |
| 1989 | 93,098,368 | 55,335 |
| 1990 | 93,626,399 | 59,941 |
| 1991 | 94,618,143 | 59,929 |
| 1992 | 95,979,021 | 59,219 |
| 1993 | 96,602,452 | 58,970 |
| 1994 | 97,262,728 | 57,079 |
| 1995 | 99,087,651 | 56,941 |
| 1996 | 99,683,966 | 49,682 |
| 1997 | 101,083,771 | 50,311 |
| 1998 | 102,584,218 | 50,353 |
| 1999 | 103,992,289 | 50,785 |
| 2000 | 104,781,947 | 51,016 |
| 2001 | 108,289,767 | 78,054 |
| 2002 | 109,388,768 | 78,265 |
| 2003 | 111,381,703 | 78,310 |
| 2004 | 112,116,531 | 77,149 |
| 2005 | 113,475,724 | 76,447 |
| 2006 | 114,510,050 | 75,939 |
| 2007 | 116,131,345 | 75,477 |
| 2008 | 116,880,816 | 75,872 |
| 2009 | 117,260,875 | 76,185 |
| 2010 | 118,516,367 | 76,260 |
| 2011 | 119,994,385 | 75,188 |
| 2012 | 121,165,766 | 74,383 |
| 2013 | 122,549,414 | 74,821 |
| 2014* | 124,025,589 | 22,672 |
| 2015 | 124,727,293 | 74,257 |
| 2016 | 126,067,560 | 69,484 |
| 2017 | 126,519,332 | 69,957 |
| 2018 | 127,679,092 | 67,909 |
| 2019 | 128,674,487 | 68,345 |
| 2020 | 128,588,200 | 60,460 |
| 2021 | 130,023,134 | 62,850 |
| 2022 | 131,314,715 | 59,148 |
| 2023 | 131,660,909 | 56,839 |
| 2024 | 132,391,325 | 56,251 |
| 2025 | 134,963,893 | 55,762 |
| 2026 | 137,123,797 | 53,344 |
*2014 was a special year for the ASEC. The Census Bureau tweaked their income questionnaire [PDF] (and also changed the health insurance questions). The data in this post uses the 3/8 sample, which makes 2014 comparable to 2015 and beyond in methodology.
Conclusions on income percentile by year
The top-coding and methodology changes in the 1990s – and again in 2010-2011 – muddy the waters a bit, but this is a great way to compare the middle quantiles, especially. Still, I want to stress how careful you need to be with these comparisons.
First, the data isn't longitudinal – you aren't seeing anything about an individual household's earnings. Some of the lowest-earning households in the 70s could be the highest in the 2010s.
Second, there are more than twice as many households in later years than earlier (seriously – check the chart above).
So yes, income has increased across the board AND the absolute number of households earning an income has increased too. Plus, households are getting smaller as people have fewer children – aggregating income statistics is hiding a lot about demographics. See our income percentile by age series for one exploded view.
