
On this page is the United States average individual income by year and median individual income by year between 1962 and 2025, as well as the top 5% and 10% income thresholds.
You'll also find the top 1% individual income by year between 1996 and 2025. Additionally, find an income by year calculator just below so you can compare two years, with or without inflation adjustments.
After: You can find the household income by year research here.
Individual Income Percentile by Year Calculator
Note: Incomes are earned in the full calendar year before (Jan - Dec) the survey year. Be sure to read the methodology if you use inflation-adjustments.
Individual Income Percentile Statistics from 1962-2025
These graphs summarizes the average, median, top 1%, top 5%, and top 10% individual income by year from 1962-2025. The first one is inflation adjusted, while the second is not.
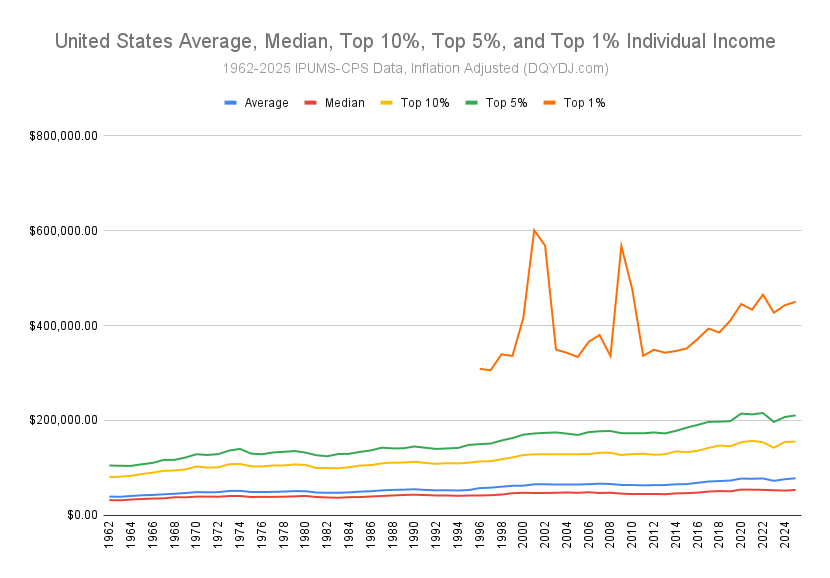
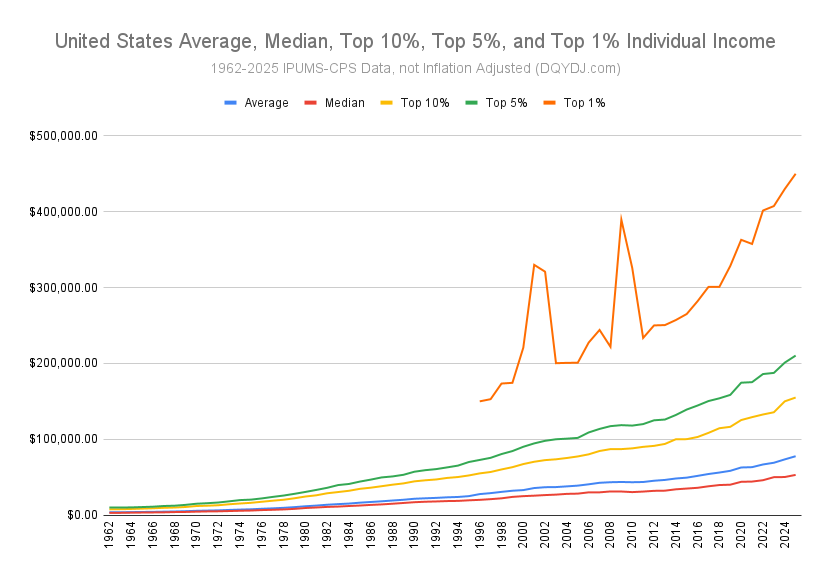
Top 1% is a tricky one – aggressive top-coding (and no methodology to repopulate data) means our data isn't immediately useful in raw form before 1996. See the notes below for more.
Median Individual Income by Year
This table shows the median individual income per year in the United States back to 1962.
| Year | Median Individual Income | Inflation Adjusted (2025) |
| 1962 | $3,000.00 | $31,558.66 |
| 1963 | $3,000.00 | $31,209.94 |
| 1964 | $3,200.00 | $32,747.83 |
| 1965 | $3,360.00 | $34,015.48 |
| 1966 | $3,500.00 | $34,870.37 |
| 1967 | $3,640.00 | $35,330.52 |
| 1968 | $4,000.00 | $37,660.00 |
| 1969 | $4,160.00 | $37,479.81 |
| 1970 | $4,550.00 | $38,943.86 |
| 1971 | $4,839.00 | $39,106.60 |
| 1972 | $5,000.00 | $38,744.86 |
| 1973 | $5,356.00 | $40,180.67 |
| 1974 | $5,720.00 | $40,339.93 |
| 1975 | $6,000.00 | $38,168.92 |
| 1976 | $6,617.00 | $38,575.27 |
| 1977 | $7,000.00 | $38,540.94 |
| 1978 | $7,500.00 | $38,798.08 |
| 1979 | $8,216.00 | $39,567.08 |
| 1980 | $9,365.00 | $40,445.63 |
| 1981 | $10,041.00 | $38,196.37 |
| 1982 | $10,804.00 | $37,259.95 |
| 1983 | $11,250.00 | $36,586.79 |
| 1984 | $12,000.00 | $37,785.95 |
| 1985 | $12,619.00 | $38,079.45 |
| 1986 | $13,450.00 | $39,204.88 |
| 1987 | $14,100.00 | $40,350.00 |
| 1988 | $15,002.00 | $41,420.48 |
| 1989 | $16,000.00 | $42,433.80 |
| 1990 | $17,000.00 | $43,025.54 |
| 1991 | $17,615.00 | $42,253.56 |
| 1992 | $18,000.00 | $41,435.21 |
| 1993 | $18,500.00 | $41,372.33 |
| 1994 | $18,720.00 | $40,657.16 |
| 1995 | $19,502.00 | $41,260.97 |
| 1996 | $20,109.00 | $41,382.78 |
| 1997 | $21,026.00 | $42,029.68 |
| 1998 | $22,126.00 | $43,264.03 |
| 1999 | $24,000.00 | $46,208.59 |
| 2000 | $25,000.00 | $47,075.00 |
| 2001 | $25,610.00 | $46,637.94 |
| 2002 | $26,400.00 | $46,765.00 |
| 2003 | $27,000.00 | $47,075.00 |
| 2004 | $28,000.00 | $47,757.25 |
| 2005 | $28,300.00 | $46,991.98 |
| 2006 | $30,000.00 | $48,199.66 |
| 2007 | $30,005.00 | $46,693.73 |
| 2008 | $31,200.00 | $47,188.43 |
| 2009 | $31,100.00 | $45,326.08 |
| 2010 | $30,324.00 | $44,366.82 |
| 2011 | $31,024.00 | $44,628.11 |
| 2012 | $32,000.00 | $44,634.07 |
| 2013 | $32,202.00 | $44,035.12 |
| 2014 | $34,000.00 | $45,762.69 |
| 2015 | $35,000.00 | $46,411.97 |
| 2016 | $36,000.00 | $47,404.20 |
| 2017 | $38,000.00 | $49,690.28 |
| 2018 | $39,632.00 | $50,732.19 |
| 2019 | $40,105.00 | $50,111.29 |
| 2020 | $43,894.00 | $53,845.21 |
| 2021 | $44,225.00 | $53,622.46 |
| 2022 | $46,001.00 | $53,271.76 |
| 2023 | $50,000.00 | $52,392.88 |
| 2024 | $50,200.00 | $51,682.12 |
| 2025 | $53,010.00 | $53,010.00 |
Average Individual Income by Year
This table includes the average individual income per year in the United States, including both inflation adjusted and nominal numbers.
Note: Yes, the 1% top-coding challenges affect the average to some degree. However, this data is reasonably close.
| Year | Average Individual Income | Inflation Adjusted (2025) |
| 1962 | $3,712.00 | $39,048.58 |
| 1963 | $3,710.00 | $38,596.30 |
| 1964 | $3,948.00 | $40,402.63 |
| 1965 | $4,122.00 | $41,729.71 |
| 1966 | $4,273.00 | $42,571.74 |
| 1967 | $4,527.00 | $43,939.90 |
| 1968 | $4,787.00 | $45,069.61 |
| 1969 | $5,168.00 | $46,561.45 |
| 1970 | $5,663.00 | $48,470.13 |
| 1971 | $5,967.00 | $48,222.58 |
| 1972 | $6,243.00 | $48,376.83 |
| 1973 | $6,796.00 | $50,983.54 |
| 1974 | $7,267.00 | $51,250.04 |
| 1975 | $7,653.00 | $48,684.46 |
| 1976 | $8,345.00 | $48,649.02 |
| 1977 | $8,892.00 | $48,958.00 |
| 1978 | $9,591.00 | $49,614.98 |
| 1979 | $10,507.00 | $50,600.21 |
| 1980 | $11,657.00 | $50,344.34 |
| 1981 | $12,531.00 | $47,668.43 |
| 1982 | $13,675.00 | $47,161.22 |
| 1983 | $14,478.00 | $47,084.76 |
| 1984 | $15,215.00 | $47,909.44 |
| 1985 | $16,390.00 | $49,458.93 |
| 1986 | $17,295.00 | $50,412.52 |
| 1987 | $18,203.00 | $52,091.56 |
| 1988 | $19,239.00 | $53,118.82 |
| 1989 | $20,220.00 | $53,625.72 |
| 1990 | $21,547.00 | $54,533.60 |
| 1991 | $22,158.00 | $53,150.97 |
| 1992 | $22,707.00 | $52,270.51 |
| 1993 | $23,444.00 | $52,428.80 |
| 1994 | $23,906.00 | $51,920.41 |
| 1995 | $25,000.00 | $52,893.26 |
| 1996 | $27,699.00 | $57,002.42 |
| 1997 | $28,965.00 | $57,899.25 |
| 1998 | $30,626.00 | $59,884.48 |
| 1999 | $32,127.00 | $61,855.97 |
| 2000 | $32,971.00 | $62,084.39 |
| 2001 | $35,676.00 | $64,968.96 |
| 2002 | $36,782.00 | $65,155.70 |
| 2003 | $36,957.00 | $64,435.21 |
| 2004 | $37,886.00 | $64,618.97 |
| 2005 | $38,853.00 | $64,515.17 |
| 2006 | $40,607.00 | $65,241.45 |
| 2007 | $42,608.00 | $66,306.50 |
| 2008 | $43,356.00 | $65,573.77 |
| 2009 | $43,672.00 | $63,648.90 |
| 2010 | $43,356.00 | $63,433.84 |
| 2011 | $43,638.00 | $62,773.38 |
| 2012 | $45,312.00 | $63,201.85 |
| 2013 | $46,377.00 | $63,418.95 |
| 2014 | $48,258.00 | $64,953.41 |
| 2015 | $49,382.00 | $65,483.31 |
| 2016 | $51,729.00 | $68,115.88 |
| 2017 | $54,187.00 | $70,857.03 |
| 2018 | $56,129.00 | $71,849.70 |
| 2019 | $58,394.00 | $72,963.44 |
| 2020 | $62,797.00 | $77,033.71 |
| 2021 | $63,214.00 | $76,646.47 |
| 2022 | $66,755.00 | $77,306.07 |
| 2023 | $69,030.00 | $72,333.61 |
| 2024 | $73,472.00 | $75,641.21 |
| 2025 | $77,652.10 | $77,652.10 |
Top 10% Individual Income by Year
This table summarized the top 10% individual income by year in the US. As in other tables, you'll find both non inflation-adjusted and inflation-adjusted numbers.
| Year | Top 10% Individual Income | Inflation Adjusted (2025) |
| 1962 | $7,613.00 | $80,085.36 |
| 1963 | $7,800.00 | $81,145.86 |
| 1964 | $8,100.00 | $82,892.93 |
| 1965 | $8,550.00 | $86,557.26 |
| 1966 | $9,000.00 | $89,666.67 |
| 1967 | $9,620.00 | $93,373.51 |
| 1968 | $10,000.00 | $94,150.00 |
| 1969 | $10,700.00 | $96,402.39 |
| 1970 | $12,000.00 | $102,709.09 |
| 1971 | $12,400.00 | $100,211.16 |
| 1972 | $13,001.00 | $100,744.37 |
| 1973 | $14,300.00 | $107,278.49 |
| 1974 | $15,307.00 | $107,951.61 |
| 1975 | $16,200.00 | $103,056.08 |
| 1976 | $17,600.00 | $102,603.10 |
| 1977 | $19,000.00 | $104,611.11 |
| 1978 | $20,250.00 | $104,754.81 |
| 1979 | $22,200.00 | $106,912.02 |
| 1980 | $24,503.00 | $105,823.74 |
| 1981 | $26,110.00 | $99,323.49 |
| 1982 | $28,798.00 | $99,316.18 |
| 1983 | $30,400.00 | $98,865.63 |
| 1984 | $32,075.00 | $100,998.70 |
| 1985 | $34,638.00 | $104,524.61 |
| 1986 | $36,150.00 | $105,372.21 |
| 1987 | $38,105.00 | $109,045.16 |
| 1988 | $40,124.00 | $110,782.25 |
| 1989 | $41,800.00 | $110,858.31 |
| 1990 | $44,500.00 | $112,625.67 |
| 1991 | $45,900.00 | $110,101.53 |
| 1992 | $47,000.00 | $108,191.93 |
| 1993 | $49,000.00 | $109,580.76 |
| 1994 | $50,200.00 | $109,027.22 |
| 1995 | $52,290.00 | $110,631.54 |
| 1996 | $55,011.00 | $113,208.43 |
| 1997 | $56,850.00 | $113,639.65 |
| 1998 | $60,208.00 | $117,727.58 |
| 1999 | $63,200.00 | $121,682.62 |
| 2000 | $67,300.00 | $126,725.90 |
| 2001 | $70,360.00 | $128,131.41 |
| 2002 | $72,498.00 | $128,423.08 |
| 2003 | $73,577.00 | $128,282.86 |
| 2004 | $75,304.00 | $128,439.70 |
| 2005 | $77,351.00 | $128,440.86 |
| 2006 | $80,125.00 | $128,733.26 |
| 2007 | $84,537.00 | $131,556.34 |
| 2008 | $87,000.00 | $131,583.13 |
| 2009 | $87,025.00 | $126,832.88 |
| 2010 | $88,010.00 | $128,766.77 |
| 2011 | $90,000.00 | $129,465.24 |
| 2012 | $91,280.00 | $127,318.70 |
| 2013 | $93,854.00 | $128,342.11 |
| 2014 | $100,000.00 | $134,596.14 |
| 2015 | $100,115.00 | $132,758.13 |
| 2016 | $103,000.00 | $135,628.67 |
| 2017 | $108,444.00 | $141,805.59 |
| 2018 | $114,560.00 | $146,646.15 |
| 2019 | $116,400.00 | $145,442.07 |
| 2020 | $125,330.00 | $153,743.58 |
| 2021 | $129,181.00 | $156,630.92 |
| 2022 | $132,676.00 | $153,646.31 |
| 2023 | $135,605.00 | $142,094.72 |
| 2024 | $150,000.00 | $154,428.65 |
| 2025 | $155,042.00 | $155,042.00 |
Top 5% Individual Income by Year
Below I've listed the estimated top 5% individual income per year in the United States. You'll again find both inflation adjusted and nominal numbers.
| Year | Top 5% Individual Income | Inflation Adjusted (2025) |
| 1962 | $9,950.00 | $104,669.55 |
| 1963 | $10,000.00 | $104,033.15 |
| 1964 | $10,150.00 | $103,872.01 |
| 1965 | $10,600.00 | $107,310.75 |
| 1966 | $11,066.00 | $110,250.15 |
| 1967 | $12,000.00 | $116,474.23 |
| 1968 | $12,390.00 | $116,651.85 |
| 1969 | $13,500.00 | $121,629.19 |
| 1970 | $15,000.00 | $128,386.36 |
| 1971 | $15,700.00 | $126,880.26 |
| 1972 | $16,600.00 | $128,632.92 |
| 1973 | $18,160.00 | $136,236.18 |
| 1974 | $19,800.00 | $139,638.20 |
| 1975 | $20,400.00 | $129,774.32 |
| 1976 | $22,010.00 | $128,312.17 |
| 1977 | $24,000.00 | $132,140.35 |
| 1978 | $25,794.00 | $133,434.35 |
| 1979 | $28,072.00 | $135,190.73 |
| 1980 | $30,550.00 | $131,939.56 |
| 1981 | $33,200.00 | $126,294.14 |
| 1982 | $36,006.00 | $124,174.54 |
| 1983 | $39,599.00 | $128,782.24 |
| 1984 | $41,060.00 | $129,290.94 |
| 1985 | $44,206.00 | $133,397.27 |
| 1986 | $46,800.00 | $136,415.48 |
| 1987 | $49,700.00 | $142,226.60 |
| 1988 | $51,000.00 | $140,810.85 |
| 1989 | $53,153.00 | $140,967.75 |
| 1990 | $57,205.00 | $144,780.93 |
| 1991 | $59,235.00 | $142,088.54 |
| 1992 | $60,643.00 | $139,597.52 |
| 1993 | $62,900.00 | $140,665.91 |
| 1994 | $65,250.00 | $141,713.67 |
| 1995 | $70,000.00 | $148,101.12 |
| 1996 | $72,750.00 | $149,713.93 |
| 1997 | $75,523.00 | $150,965.83 |
| 1998 | $80,500.00 | $157,405.50 |
| 1999 | $84,424.00 | $162,546.41 |
| 2000 | $90,100.00 | $169,658.30 |
| 2001 | $94,556.00 | $172,194.34 |
| 2002 | $97,966.00 | $173,537.14 |
| 2003 | $100,000.00 | $174,351.85 |
| 2004 | $100,804.00 | $171,932.91 |
| 2005 | $101,808.00 | $169,051.56 |
| 2006 | $108,984.00 | $175,099.72 |
| 2007 | $113,645.00 | $176,854.16 |
| 2008 | $117,300.00 | $177,410.36 |
| 2009 | $118,612.00 | $172,868.73 |
| 2010 | $118,030.00 | $172,688.80 |
| 2011 | $120,000.00 | $172,620.32 |
| 2012 | $125,000.00 | $174,351.85 |
| 2013 | $126,008.00 | $172,311.59 |
| 2014 | $132,000.00 | $177,666.90 |
| 2015 | $139,187.00 | $184,569.80 |
| 2016 | $144,507.00 | $190,284.39 |
| 2017 | $150,404.00 | $196,674.12 |
| 2018 | $154,000.00 | $197,132.56 |
| 2019 | $158,526.00 | $198,078.61 |
| 2020 | $174,600.00 | $214,183.58 |
| 2021 | $175,300.00 | $212,549.84 |
| 2022 | $186,006.00 | $215,405.47 |
| 2023 | $187,506.00 | $196,479.58 |
| 2024 | $201,050.00 | $206,985.87 |
| 2025 | $210,351.00 | $210,351.00 |
Top 1% Individual Income by Year
Here is the top 1% individual income by year in the US, from 1996 on.
| Year | Top 1% Household Income | Inflation Adjusted (2025) |
| 1996 | $150,000.00 | $308,688.52 |
| 1997 | $152,877.00 | $305,591.71 |
| 1998 | $173,500.00 | $339,252.86 |
| 1999 | $174,424.00 | $335,828.62 |
| 2000 | $220,822.00 | $415,807.83 |
| 2001 | $329,998.00 | $600,953.80 |
| 2002 | $320,966.00 | $568,559.72 |
| 2003 | $200,319.00 | $349,259.89 |
| 2004 | $200,750.00 | $342,402.40 |
| 2005 | $200,921.00 | $333,628.08 |
| 2006 | $227,500.00 | $365,514.08 |
| 2007 | $244,157.00 | $379,956.72 |
| 2008 | $221,929.00 | $335,656.47 |
| 2009 | $389,599.00 | $567,813.40 |
| 2010 | $325,846.00 | $476,742.83 |
| 2011 | $233,600.00 | $336,034.22 |
| 2012 | $250,150.00 | $348,912.93 |
| 2013 | $250,562.00 | $342,634.89 |
| 2014 | $257,200.00 | $346,181.27 |
| 2015 | $265,169.00 | $351,629.03 |
| 2016 | $282,110.00 | $371,477.71 |
| 2017 | $301,000.00 | $393,599.31 |
| 2018 | $301,016.00 | $385,325.04 |
| 2019 | $328,551.00 | $410,525.24 |
| 2020 | $363,002.00 | $445,298.22 |
| 2021 | $357,552.00 | $433,528.92 |
| 2022 | $401,622.00 | $465,101.00 |
| 2023 | $407,500.00 | $427,001.95 |
| 2024 | $430,000.00 | $442,695.46 |
| 2025 | $450,100.00 | $450,100.00 |
See the FAQ note below regarding 1962-1995 top 1% income data.
Other Individual Income by Year Questions
Where is the top 1% income level for 1995 and earlier data?
The Census Bureau changed its top coding procedure for the 1996 survey. To keep the methodology constant, I don't attempt to model the top 1% for that time-frame – you'll have to look elsewhere.
Yes, this affects average income some small amount as well. In your head, assume average income is a few dollars more per year before 1996.
What other calculators and pages do you have?
There's a whole calculator page here if you're keen but for something more topical...
Use the income growth by percentile tool to see how percentiles changed relative to each other. See our individual income calculator and research. Also, see our net worth calculator and net worth by age calculator.
Source and Methodology on the Individual Income by Year Data
Sarah Flood, Miriam King, Renae Rodgers, Steven Ruggles, J. Robert Warren, Daniel Backman, Etienne Breton, Grace Cooper, Julia A. Rivera Drew, Stephanie Richards, David Van Riper, and Kari C.W. Williams. IPUMS CPS: Version 13.0 [dataset]. Minneapolis, MN: IPUMS, 2025. https://doi.org/10.18128/D030.V13.0
The methodology here is different than our individual income research and individual income calculator. In this version, for older years, I only use variables which are available back to 1962. People who show up in either of these measures made the screen:
- LABFORCE - A snapshot of labor force participation in the previous week
- WKSWORK2 - Buckets of weeks worked in the previous year (I used 1-52 here)
Starting in 2021, I use the more extensive screen (including people who "Want" to work - see the annual posts for more.)
Notes on Workforce Size and Data Quality
Interested in the workforce size by year? I've got you.
Please note this is a different number than the instantaneous workforce which you might find in a monthly survey. It's basically anyone who worked at all in the previous year.
Care about data quality? Well then... you should run the numbers yourself and apply your own personal biases screens. I have summarized the samples here so you can see what we're working with.
| Year | Samples | Estimated Workforce |
| 1962* | 34,331 | 61,448,670 |
| 1963* | 23,325 | 54,078,001 |
| 1964 | 35,131 | 85,346,941 |
| 1965 | 35,242 | 87,133,031 |
| 1966 | 72,351 | 90,083,575 |
| 1967 | 45,926 | 92,629,900 |
| 1968 | 72,508 | 94,181,272 |
| 1969 | 74,198 | 96,613,960 |
| 1970 | 70,311 | 98,028,824 |
| 1971 | 71,224 | 99,115,922 |
| 1972 | 68,718 | 101,321,942 |
| 1973 | 67,490 | 103,161,900 |
| 1974 | 67,208 | 106,554,083 |
| 1975 | 66,330 | 108,380,735 |
| 1976 | 67,368 | 107,518,856 |
| 1977 | 82,434 | 110,760,428 |
| 1978 | 81,303 | 113,560,472 |
| 1979 | 81,892 | 116,484,113 |
| 1980 | 96,787 | 117,679,012 |
| 1981 | 96,451 | 121,233,236 |
| 1982 | 86,253 | 122,425,629 |
| 1983 | 85,654 | 122,619,989 |
| 1984 | 85,222 | 124,485,036 |
| 1985 | 86,412 | 127,130,646 |
| 1986 | 84,657 | 129,167,517 |
| 1987 | 84,177 | 131,223,880 |
| 1988 | 84,708 | 133,258,849 |
| 1989 | 79,317 | 135,493,547 |
| 1990 | 87,001 | 137,581,317 |
| 1991 | 86,383 | 138,085,457 |
| 1992 | 84,566 | 138,493,774 |
| 1993 | 83,406 | 139,157,683 |
| 1994 | 80,967 | 142,302,606 |
| 1995 | 80,589 | 143,817,961 |
| 1996 | 70,419 | 145,151,098 |
| 1997 | 71,844 | 147,934,921 |
| 1998 | 71,974 | 149,487,450 |
| 1999 | 72,492 | 150,996,472 |
| 2000 | 74,135 | 153,649,301 |
| 2001 | 119,056 | 156,928,040 |
| 2002 | 117,443 | 156,761,460 |
| 2003 | 115,941 | 157,846,862 |
| 2004 | 113,981 | 158,065,281 |
| 2005 | 112,342 | 159,585,292 |
| 2006 | 111,710 | 161,667,995 |
| 2007 | 110,791 | 163,721,174 |
| 2008 | 111,033 | 164,862,179 |
| 2009 | 111,455 | 165,228,670 |
| 2010 | 111,115 | 164,601,724 |
| 2011 | 107,820 | 163,980,091 |
| 2012 | 105,533 | 164,815,765 |
| 2013 | 106,075 | 166,391,316 |
| 2014** | 103,970 | 166,897,710 |
| 2015 | 102,998 | 167,944,362 |
| 2016 | 95,945 | 170,398,397 |
| 2017 | 96,536 | 171,360,200 |
| 2018 | 93,217 | 172,805,768 |
| 2019 | 93,833 | 174,033,390 |
| 2020 | 82,675 | 175,295,712 |
| 2021 | 84,967 | 174,458,178 |
| 2022 | 79,141 | 176,094,143 |
| 2023 | 76,214 | 178,452,868 |
| 2024 | 76,302 | 180,388,021 |
| 2025 | 75,234 | 183,174,900 |
*1962 & 1963 had even more aggressive top-coding than later years. Assume the workforce was actually closer in size to 1964 and beyond.
**2014 was a special year in the ASEC. The Census Bureau tweaked their income questions [PDF]. The data in this post uses the whole sample, which blends the methodologies together.
Does it matter? It depends on your use case.
Inflation vs. Individual Income by Year
Inflation is... controversial.
Of course, IPUMS makes an adjustment easy. They provide simple to use charts to adjust survey numbers for CPI. That part is fine, and the math is easy enough.
Inflation is meant to be one number summarizing the aggregate change in cost of a basket of goods over time. It – by definition – won't apply to every person equally. It follows, then, that it won't apply to every income bracket equally. Heck, just picking the right inflation adjustment is controversial.
The upper percentiles – comprised of people who generally save more money – are affected less by inflation than the middle of the curve.
Of course, any illustrative example is also a generalization and a dodge. For example, since the 1980s, people consuming more education and medical care experience more "inflation" than others.
We need to account for inflation somehow. And no, there isn't a fair way to do it across the spectrum. Just know that the math is fuzzy.
Conclusions on Individual Income Percentile by Year
Unlike with households, it's easier to compare individuals over time (but note things like the age of workforce change).
As with the household data, we also don't have the best view into the top 1% before 1996. (But we do have plenty of years to scoff at!).
The top-coding and methodology changes in the 1990s muddy the waters some, but the tool is very useful especially for the 95th percentile and below.
Limits to the Data
This data isn't longitudinal. The top 1%, for example, doesn't always comprise the same people.
To see what I mean, look at the workforce table, the top 1% actually comprises three times more individuals near the end, while also increasing in dollar value.
The takeaway: we've seen broad gains across the income spectrum. However – using the ASEC data in this tool and the charts – we can't trace individuals up and down over the years.
