
One of the big international stories we've been following closely at DQYDJ in the last year is the decline in the benchmark China stock market index, the Shanghai Stock Exchange Composite Index. Notably, we exclaimed how closely the index was mirroring the decline in the NASDAQ's own precipitous fall which from a peak in March of 2000 (and if not mirroring, certainly rhyming). So, let's revisit the two stock markets today and see how the Shanghai Composite compares to the NASDAQ Bubble which popped at the turn of the century.
How the Shanghai Composite Compares to the NASDAQ Bubble: The Peaks
For this series, we're looking at two events roughly a decade and a half apart. We begin with the Shanghai Composite, which reached its closing peak on June 12, 2015 at a value of 5166.35.
Here is the Shanghai Composite's history - note that the SSE is a broader index than the NASDAQ was (at least historically), and it also saw a large run-up roughly a decade before the 2015 peak:
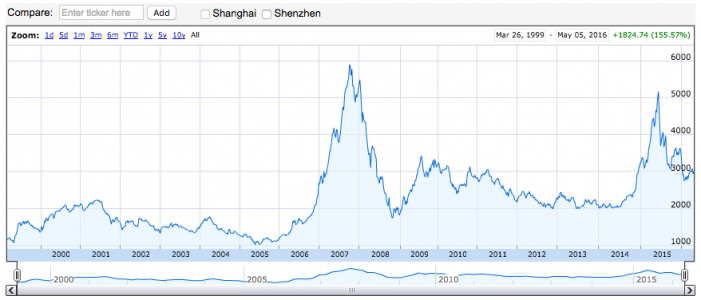
Shanghai Composite History from Google Finance
The NASDAQ's closing peak came on March 10, 2000 at an eerily similar 5048.62 - after hitting an intraday high of 5132.52. As you probably recall, the NASDAQ didn't come close to those peaks for a long time... only recrossing that closing high halfway through 2015. (Not, of course, accounting for dividends and inflation - but that's the topic for a different article).
Here is a chart of the NASDAQ's peak in 2000 followed by the subsequent poor investment performance. (Although, that performance was not horrible if you stuck with it and continued to invest periodically - please see our study of dollar cost averaging on the NASDAQ).
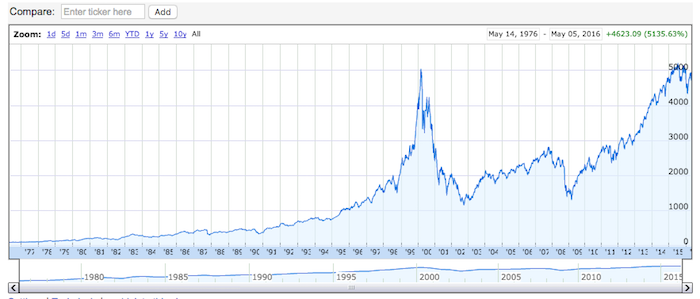
NASDAQ Chart from Google Finance
On the Same Scale, the NASDAQ Bubble Pop was Worse (So Far?)
It's in our interest to try to align and normalize the two.
Our method isn't perfect, but we decided to look at trading days or days in the market to compare the Shanghai Composite to the NASDAQ. This method, yes, does ignore inflation and dividends - although dividend payouts were low on both indices in the periods in question. As for inflation... if you have reliable inflation numbers for China, please let me know.
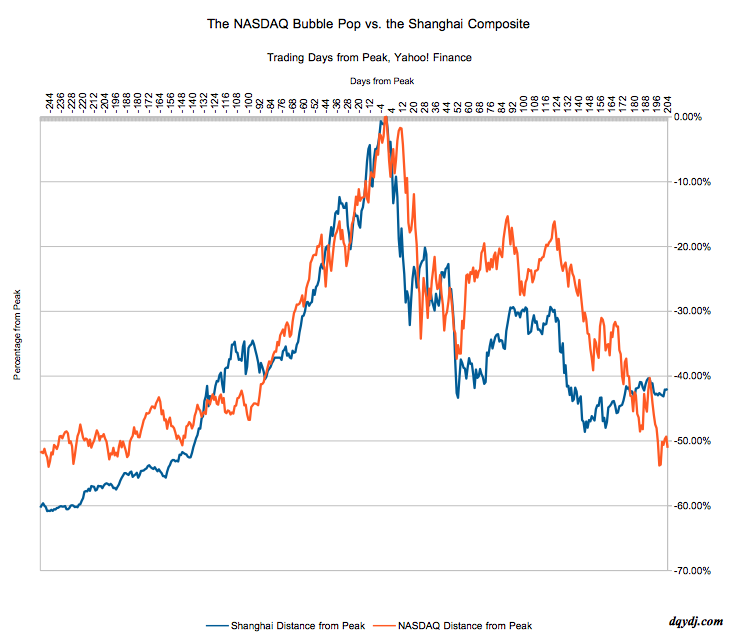
How the Shanghai Composite Compares to the NASDAQ Bubble Visually
Even though the Shanghai Composite has stabilized some recently, it is still down over 40% since the peak. At this point, however, the NASDAQ had shed more than half of its value.
Here's the summary table, through Wednesday, May 5:
| Trading Days Since Peak | SSE Distance from Peak | NASDAQ Distance from Peak | Shanghai Composite Close | NASDAQ Close |
| 0 | 0 | 0 | 5166.35 | 5048.62 |
| 204 | -41.97% | -51.07% | 2997.84 | 2470.52 |
As for the market mechanisms, rules, and conventions themselves - the US and China might be closer than you think. We wrote a detailed post about politics and markets in the two countries, which will help you to put this data in context. Still - the picture really says it all: you're still looking at two comparable investment events.
In Investing, "He Who Ignores History..."
All of you reading probably have some recollection of the NASDAQ Bubble bursting and the subsequent aftermath.
15 years is a long time to not see nominal - let alone real - investment gains... for people (and there were many!) who were heavily concentrated in technology.
That's the reason we try to study historical similarities like these - although we caught a lot of angry comments for our articles on this topic when the Shanghai first started plunging, know that we seek only to examine this relationship... not to predict exactly what (and when) will happen. Fundamentally, studying historical investment performance is one way we know what is possible in the markets, and helps us plan accordingly.
And, yes, before you ask - we will be looking at the initial fall and subsequent poor performance of the Japanese markets (over longer than 15 years) soon - make sure you subscribe to our feed and don't rely on serendipity and luck to find it when it's ready!
What do you think about how the Shanghai Composite compares to the NASDAQ bubble? Does this comparison still hold up? What's next for the markets - in China, the US, or elsewhere?
