
Today we're going to look at the S&P 500 through a lens that we really enjoy here on DQYDJ. We're going to look at closing prices since 1994 and track them through Friday's close. However, instead of just staring at the nominal S&P 500 index, we're going to look at reinvested dividends and inflation adjustments.
Let's dig in!
The Dividends Reinvested, Inflation Adjusted S&P 500 Through October 2016
S&P Dow Jones Indices puts out an index known as the Total Return Index which assumes that all dividends are reinvested on the day they are paid out. Although this ignores the effects of delay, taxes, fees, and a few other sources of error, it gets us a long way to our goal.
For inflation, we use the CPI-U from the Bureau of Economic Analysis through FRED. All dates before September use straight line interpolation, while later dates use extrapolation for monthly amounts and interpolation for individual days.
Mash everything together and you get a chart looking like this:
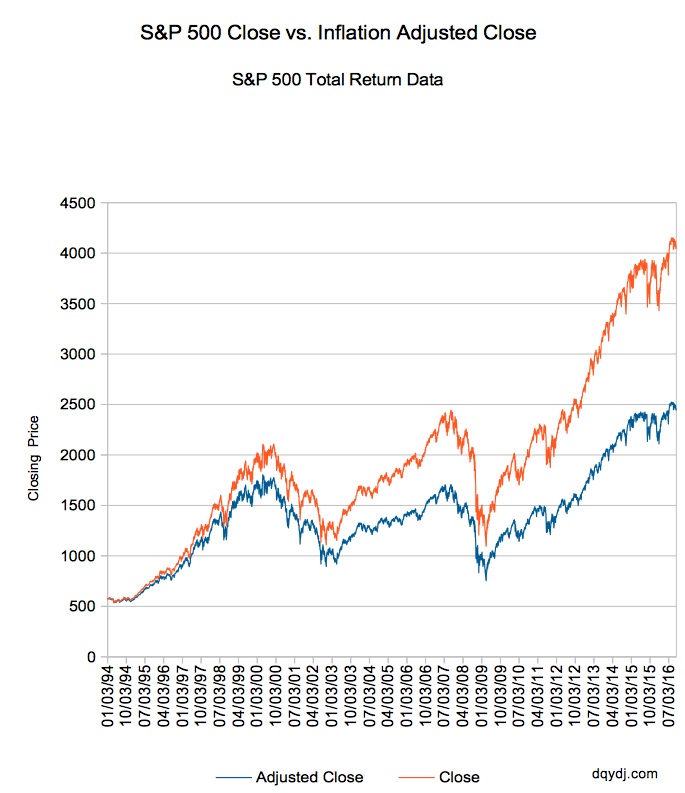
When you look at returns this way, here are how things have shaken out since the S&P 500's bottom on March 9, 2009 to our adjusted peak on August 15, 2016:
3/9/2008 Close: 1095.04 Nom / 753.85 Adj
8/15/2016 Close: 4120.29 Nom / 2501.89 Adj
So, a 232% gain trough to peak.
As of Friday, we closed at a dividend readjusted nominal price of 4073.85, which works out to 2461.53 inflation adjusted... still a 227% real gain. Annualizing that over 3,148 days (roughly 8.62 years) means we've seen roughly a 14.7% annual real gain since the Great Recession's trough. Not bad - certainly your stock investments have been outpacing inflation by quite a bit.
But What About Now?
Since we don't have a crystal ball to visualize future returns, all we can do is comment on the recent past. It's interesting to note that returns have seemed to plateau since roughly late 2014... we saw an adjusted close of 2381.89 on 12/29/2014 and have returned a (real, inflation adjusted) 3.2% since then.
3.2% doesn't seem like a huge return, but that's actually quite a bit - remember that we're already adjusting for cost of living increases as measured by CPI. Outpacing inflation by 3.2% with your investments is quite the gain... and in this case mostly fueled by reinvesting your dividends.
Although I'm on record (but Cameron isn't!) saying the current level of the S&P 500 worries me, you should note that, at least through the recent past, it's been a great investment. There will always be political risk, international risk and oh-so-many-other risks, but stocks have blasted right on through most of those things in the last couple centuries.
Let's hope they keep it up, eh?
The Proper Way to Visualize Returns
The proper way to visualize the long term performance of stocks isn't using the nominal performance suggested by the closing price of an index. Investing doesn't happen in a vacuum - you need to consider all sources of returns (including dividends!). On top of that, prices themselves aren't completely stable... your dollar today will probably be worth more than a dollar next week. Furthermore - and this isn't something we can help you with, easily - you'll want to adjust all of this performance for taxes.
For long time readers, these are some of the tenets of investing that we continually preach to you. Adjusting your investment performance for dividend reinvestment and for inflationary pressure isn't just unnecessary math - it's the right thing to do.
If you agree, don't forget we've got a number of calculators that do this math for you (generally with a monthly resolution). Enjoy!
