
3.7%.
The significance of that number? In this instance, I'm talking about the most recent BLS unemployment report for June 2019.
The top-line number, U3 (total unemployed as a percentage of the labor force), is the rate most often quoted in news stories and reports.
Why Look at The Civilian Employment-Population Ratio
U3 is defined as the total unemployed (over age 16) divided by the total civilian labor force. That means you've got two variables which, theoretically, can be messed with to make numbers appear a certain way.
First, you've got the total unemployed.
To determine 'unemployment status', people have to demonstrate they are looking by contacting companies, filling out applications, sending resumes, placing or answering job ads, contacting union or professional registers, and/or some other means in the last 4 weeks.
Even though this seems pretty cut and dry, it's not always easy to place a person in a category. 15 hours of part time work for a family owned enterprise? Employed. Any part time paid work? Employed. Self-employed, even if no money was made in a week? Employed.
Secondly, you've got the nebulous labor force.
It is politically advantageous to over-count labor force, as increasing the denominator will lower the top-line number. However, it isn't exactly easy to estimate how large the labor force is (you can't survey everyone... well, except during the census). That's why you see lots of complaints when the report includes large swings in the estimated labor force (this report had an incredibly high 1.25 million person adjustment).
70 Years of Employment, Summarized
On the other hand, you've got the civilian employment-population ratio.
The denominator in this one is hard to count, although the numerator might be open to some tricks. Basically, take the number of employed, non institutionalized civilians over 16 and divide by the total population fitting those criteria.
Let's see how it looks (St. Louis Fed data):
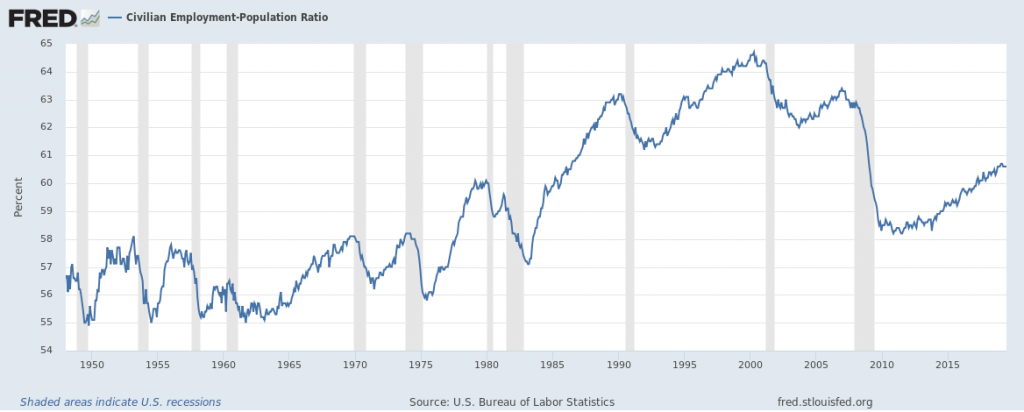
We'd expect the ratio is now lower since Baby Boomers are retiring faster than people are entering the workforce (currently - this won't be true forever.
The number currently sits at 60.6%, where it hasn't been since 1986 (well, pre-Great Recession). That is, even though unemployment is at a very low 3.6%, the number of people working is still as low as its been in the previous 40 years.
And there you have it - another thing to monitor in the jobs report!
What do you think about this ratio? Is it more or less useful than the top-line unemployment numbers?
