
Here is a NASDAQ Historical Period Return Calculator. Explore the historical performance of the NASDAQ Composite Index over custom time periods, analyzing rolling returns, volatility, and more.
Updated through the most recent market close. For last year's performance, see the 2023 NASDAQ Return.
NASDAQ Historical Period Return Calculator
Input your desired investment length(s) to analyze the NASDAQ Composite Index's historical performance over rolling periods of that length. You can also adjust for inflation and reinvestment of dividends to see a more accurate reflection of total returns.
- Adjust for Inflation (CPI)? - Choose whether to adjust the returns for inflation to reflect real purchasing power changes over the investment period.
- Reinvest Dividends - Decide if you want to calculate the growth of your investment with dividends reinvested back into the index.
- + Add More Periods - By default, the tool has three investment lengths input - 10, 20, and 30 years. To add more periods to your investment, click the button.
- - Remove - If you have too many periods in your analysis, remove a period from the analysis with the Remove button.
When you're happy with your inputs, hit the Calculate Historical Returns button to start the analysis.
NASDAQ Rolling Period Analysis Outputs
When you start the analysis, the tool will output returns for the rolling periods you selected:
- Using (CPI) Inflation Adjustment - Whether the rolling period results are adjusted for inflation.
- Calculating Dividend Reinvestment - Whether the rolling period results are adjusted for inflation.
- Monthly Realized Historical Volatility - For month over month periods, we have calculated the historical volatility. (See here for an explanation.)
- Annual Realized Historical Volatility - The same calculation for year over year results.
- Summary Statistics - Average, median, maximum and minimum return as well as the standard deviation of returns for all of your selected periods.
Percentile Table
For every period you selected, the tool computes the percentage of periods that beat a particular return. You can find this in the Results for Period(s) tab. The return is beaten by the percentage of rolling periods in the far left column.
Here's an example of an interpretation:
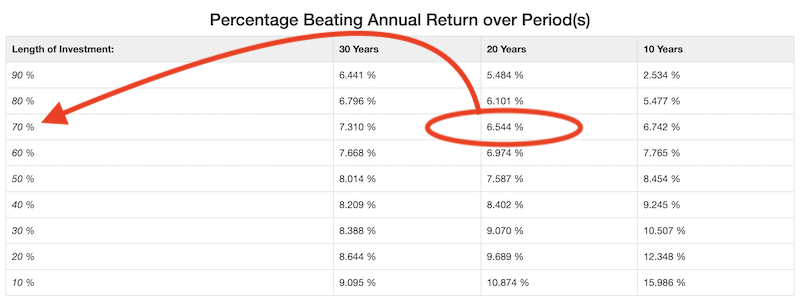
In the above screenshot, I've highlighted 6.544% in the 20 Years column. Tracing the row, i see the 70% label. That means, for my run (and the data in the tool and history to that point):
70% of all 20 year rolling periods in the data to this point returned 6.544% a year or more.
Period and Percentile Graph
In the Chart for Period(s) tab, you'll find a graph of rolling period historical returns. There will be a separate line for each period length you choose.
In the following screenshot, for my run (and the data up to that point), the tool graphed rolling 10, 20, and 30 year returns.
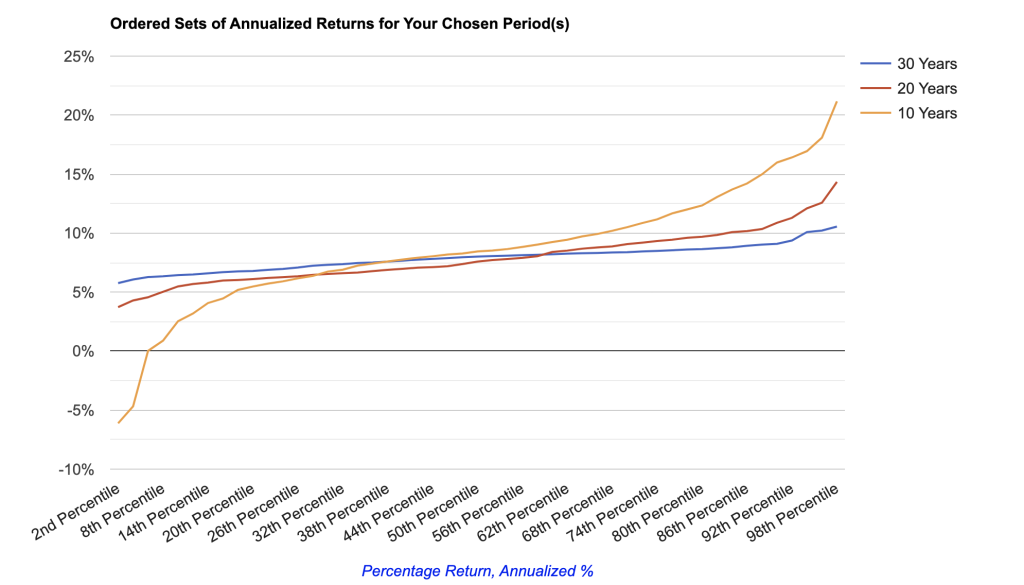
On the Y-Axis are annualized returns. On the X-Axis are the percentile of periods. To interpret this, at any point on the line, "100% minus that percentile" of returns beat it.
In my analysis, I can hover over the 10 year line for the 50th Percentile (the Median). For my example, it was 8.454%. I can interpret that to mean 100-50 = 50% of periods in the set beat that return (or tied). And yes, 50% of periods returned less annually.
Methodology for the NASDAQ Historical Return Calculator
The data for this calculator is sourced NASDAQ records and adjusted using CPI data from the U.S. Bureau of Labor Statistics to account for inflation. Dividend information is backed into and estimated - read the NASDAQ Return Calculator's Methodology section for more information.
There are some caveats to the results:
- 'Month' is an average - The tool uses monthly average closing prices for the NASDAQ, providing a smoothed estimate of performance. For example, for any random month in the dataset, the data point is the average closing price.
- Fees are not included - The calculator does not account for management fees, transaction fees, slippage, or other costs associated with investing.
- Data coverage starts from 1973 - The NASDAQ Composite Index started in 1973, but my analysis included dividend estimates back to 1973.
- Taxes are not included - The calculator does not take into account potential tax liabilities from dividends or capital gains.
I've also built a similar tool for the Dow Jones Industrial Average and S&P 500.
Disclaimers for the NASDAQ Historical Return Calculator
This tool is intended for informational and research purposes only. While we strive for accuracy, the data provided is an estimate and should be verified with additional sources. This calculator does not provide financial advice or reflect actual investment outcomes. And, importantly for this tool, know that historical returns do not imply or guarantee future returns.
