
The Dow Jones Industrial Average is composed of 30 stocks meant to "represent" the industrial health of American companies. Some of the companies included on the list are household consumables, such as McDonalds, Nike and Coca-Cola. Other sectors include technology companies such as Microsoft and Apple and financial services, including American Express, JPMorgan, Visa and Goldman Sachs. There is a lot of historical weight behind the index itself, often because of what it is meant to represent: stock trading and the financial sector. Only recently have investors been more inclined to use broader benchmarks such as the S&P 500 or Russell 2000 due to myriad reasons.
What is Price-Weighting?
The index is calculated by taking the simple sum of all the prices and dividing by a special number known as the Dow Divisor (which, trivia fact, is 0.14602128 as of 5/8/17). This number started off as 30 (to represent the typical company) but changes frequently due to changes in the index. It changes due to stock splits and companies being swapped in and out of the index (something which happens relatively frequently, most recently in 2015 when Apple replaced AT&T.
The major alternative (used by most other stock indices) is known as market-weighting. This method takes the total market capitalization (number of shares * price) and divides it equally towards an index. Thus, the different in the number of shares has no impact on the company's weight in the index, an issue that comes up with the Dow.
So What's The Problem?
The major issue with price-weighting is that it gives undue weight to companies with fewer shares, simply for the sake that it inflates their share price. Listed below are the relative weights of a few components of the Dow. Listed next to them is the impact they would have on an index given whether it's calculated using price-weighting or market-weighting.
| Company | Price-Weight | Market Weight | Delta Impact |
| GS | 7.40% | 1.49% | 5.90% |
| MMM | 6.50% | 1.99% | 4.51% |
| BA | 6.03% | 1.86% | 4.17% |
| TRV | 3.95% | 0.56% | 3.39% |
| UNH | 5.68% | 2.80% | 2.88% |
| MCD | 4.69% | 1.96% | 2.73% |
| IBM | 5.05% | 2.43% | 2.62% |
| CSCO | 1.12% | 2.87% | -1.75% |
| PFE | 1.09% | 3.33% | -2.24% |
| JPM | 2.84% | 5.15% | -2.32% |
| XOM | 2.67% | 5.80% | -3.13% |
| GE | 0.95% | 4.26% | -3.31% |
| MSFT | 2.25% | 8.89% | -6.64% |
| AAPL | 4.86% | 12.95% | -8.09% |
Errors in Analysis
The most important takeaway is that analysis errors will naturally arise when focusing on only one index (especially one with a dubious pricing mechanism). Very often financial headlines and news aggregators drive their summary based on the final result of the day. Notice the frequent use of the word 'as' when important data comes out ("Stocks mixed as Fed signals rate hike", "Investors mull consumer confidence data", "Stocks Gain Ahead of Jobs Report"). These events often tie back to whether the day was good or bad. All the events retrospectively are great when the day was a bull and bad when the day was a bear.
DJIA's correlation with S&P is driven by high # of share performers (like GS, MMM, BA)
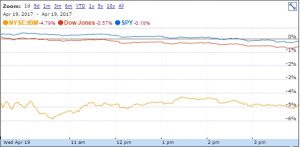
The example I selected on the right is from a few weeks ago where one of the misplaced large companies (IBM) performed way worse than the market. As you can see, the DJIA significantly lagged the S&P 500. The headlines coming out of the day were generally negative and included many references to shaken confidence. Perhaps the entire national financial headline could have been summarized with "IBM was Sold".
Cheers,
Cameron Daniels
