
Below is a stock correlation calculator which analyzes daily return correlations between individual securities. Use our tool to understand how stocks move together, identify portfolio concentration risks, and build diversified equity portfolios based on actual return relationships... rather than sector classifications alone.
The database includes over 15,000 active stocks trading on major U.S. exchanges. Correlation data is updated at least weekly, and provides comprehensive analysis for equity portfolio construction and risk management.
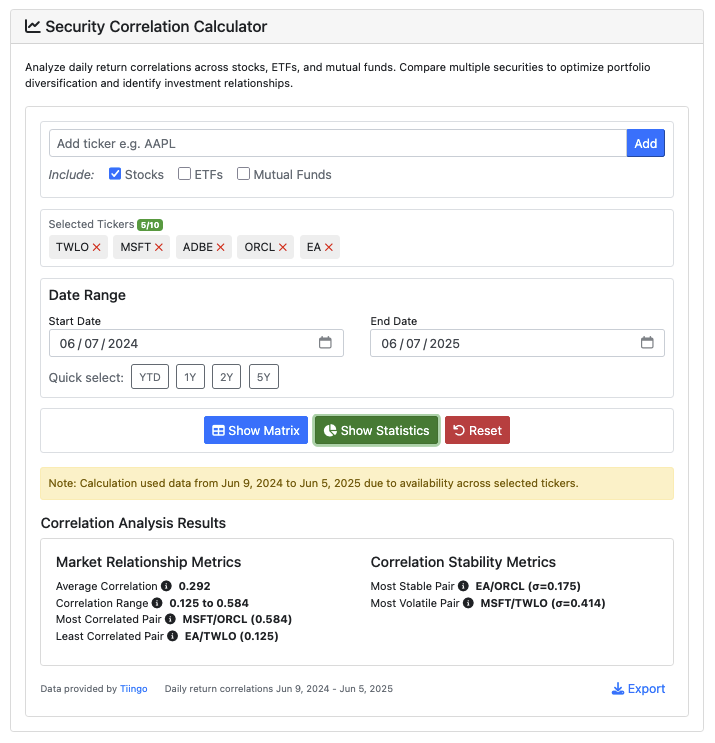
Stock correlation calculator for equity portfolio analysis
Looking for broader analysis? Try our comprehensive Security Correlation Calculator which includes stocks, ETFs, and mutual funds, plus our specialized ETF Correlation Calculator and Mutual Fund Correlation Calculator.
Using the stock correlation calculator
Start by selecting at least two stock tickers and choosing your analysis timeframe. The calculator will compute correlations using daily return data and provide insights for equity portfolio optimization.
Stock selection and portfolio inputs
The stock correlation interface provides streamlined controls for equity analysis:
- Stock Tickers: Enter valid stock symbols (e.g., AAPL, MSFT, GOOGL) for any publicly-traded equity in the Tiingo dataset. You can also choose to paste multiple tickers separated by commas or newlines (up to 10) for bulk analysis. The tool includes autocomplete and smart suggestions based on industry classifications
- Analysis Period: Choose your timeframe using quick presets (YTD, 1Y, 2Y, 5Y) or select custom date ranges – up to 10 years – for long-term correlation analysis
- Portfolio Size: Analyze up to 10 stocks simultaneously to understand correlation relationships across your entire equity portfolio
Industry-based smart suggestions
When you add individual stocks, the calculator leverages NAICS industry classifications to suggest related companies. This feature helps identify potential portfolio concentration risks and diversification opportunities. Look for the lightbulb icon next to the Add button when suggestions are available.
- Sector Analysis: Automatically identifies companies in the same industry group to reveal hidden correlations
- Diversification Opportunities: Suggests stocks from different sectors to improve portfolio balance
Analyzing stock correlation results
The calculator presents results in two formats optimized for equity analysis: an interactive correlation matrix and comprehensive portfolio statistics.
- Equity Correlation Matrix: Shows pairwise Pearson correlation coefficient between all selected stocks with color-coding for easy interpretation
- Portfolio Metrics: Calculates average correlation, identifies the most/least correlated stock pairs, and measures correlation ranges
- Relationship Stability: Determines which stock pairs maintain consistent correlations vs. those with volatile relationships
- Interactive Charts: Hover over correlation values to see rolling correlation trends and relationship strength descriptions
Stock correlation interpretation guide
Stock correlations indicate how equity prices moved relative to each other during the analysis period:
- +0.8 to +1.0: Very high positive correlation - stocks move together closely (potential concentration risk)
- +0.5 to +0.8: Moderate positive correlation - stocks often move in the same direction
- -0.2 to +0.2: Low correlation - stocks move relatively independently (good for diversification)
- -0.5 to -0.8: Moderate negative correlation - stocks often move in opposite directions
- -0.8 to -1.0: Strong negative correlation - stocks consistently move oppositely (rare in equity markets)
Exporting stock correlation analysis
Save your stock correlation analysis by clicking the Export button to download a comprehensive CSV file. The export includes the full correlation matrix, statistical summary, and analysis metadata for integration with portfolio management tools or further analysis.
Data sources and calculation methodology
Stock correlation calculations use data from the Tiingo API with the following parameters and limitations:
- Stock price data may be up to 7 days delayed
- Usage limits to ensure fair access:
- 50 correlation calculations per day
- 10 calculations per minute
- Maximum 10 stocks per correlation analysis
- Date ranges limited to 10 years
Stock correlation calculation process
Wondering what's backing the tool? Here's how it works:
- Computes daily percentage returns using adjusted closing prices for each stock
- Aligns data to common trading days across all selected stocks
- Calculates Pearson correlation coefficients between return series
- Generates stability metrics using rolling correlation windows to identify relationship consistency
Important disclaimers for stock analysis
Stock correlations are based on historical performance and past relationships do not predict future correlations.
This tool provides educational and research information only and should not be considered investment advice. Always verify results independently, and consult with the right professionals if you need help with investment decisions.
Stock correlations can change rapidly during earnings announcements, sector rotations, or market volatility. The analysis does not account for corporate actions, dividend payments, or stock splits that may occur between data updates.
Reporting issues and enhancement requests
Contact us if you discover calculation errors or data inconsistencies. Please include the specific stock tickers and date range that produced unexpected results so we can investigate.
Feature enhancement requests are welcome, but remember this is a free, advertising-supported tool. Major enhancements may require consulting arrangements. Of course, I do appreciate feedback and suggestions for improving the stock correlation calculator (and my other investing tools!).
I cannot provide personalized investment advice, stock recommendations, or portfolio optimization guidance. This tool is designed for research and educational purposes only.
Related correlation and analysis tools
Expand your portfolio analysis with specialized calculators:
- Security Correlation Calculator - Analyze stocks, ETFs, and mutual funds together
- ETF Correlation Calculator - Compare exchange-traded fund relationships
- Mutual Fund Correlation Calculator - Analyze mutual fund portfolio overlaps
- Cryptocurrency Correlation Calculator - See how cryptocurrencies move together
Stock correlation analysis in portfolio construction
Understanding stock correlations helps you build resilient equity portfolios. Many investors make the mistake of thinking they're diversified simply because they own stocks in different sectors, but running a historical correlation analysis (like the one I'm showing you here!) often reveals surprising relationships that sector classifications miss.
For example, large-cap growth stocks across different sectors (technology, consumer discretionary, healthcare) often show high correlations because they're driven by similar macroeconomic factors: interest rates, growth expectations, and institutional investment flows. A portfolio of technology and healthcare stocks might seem diversified but could show correlations above 0.8 during certain market periods.
We've also got these slick portfolio tools:
- Stock Drawdown Calculator - Measure past maximum loss and volatility
- Stock Daily Moving Average Calculator - See equity DMAs and trends
- Stock Return Calculator - Calculate total returns with dividend reinvestment
- Investment Calculator - Model future portfolio scenarios and outcomes
Beyond sector diversification
Use this stock correlation calculator to move beyond superficial diversification. Instead of relying on sector labels, this tool will help you focus on actual return relationships to build portfolios that can perform across various market environments. But remember: the goal isn't necessarily to eliminate correlated equities, but to understand the story behind the story... so you can make informed portfolio construction decisions.
