
You may have heard of 'theta' or 'time-value' decay, but in this article we're going to play it close to the vest with an illustrated example. I recently showed you the results of a "failed" model based on implied prices for an S&P 500 ETF, SPY. We're going to dedicate a few more precious time cycles to the "failed" options model, to see what we can figure out from the mess... and, possibly, come up with a better framework (or use the old one to trade?). Let's look at options time decay.
Options Time Decay
When I first began our series, I explained that options trading is three times harder than trading individual stocks. When trading a stock, you should be able to predict 'direction' - roughly, will your stock increase in price, or will it decrease?
Options are a whole other ballgame. We have three things we need to predict:
- Direction (Sorry, you didn't escape... but you can mitigate it with certain trades)
- Magnitude (Unlike with the stock market, you also need to reason out the amount a security will change)
- Timeframe (You need to know when a stock will finish making that move)
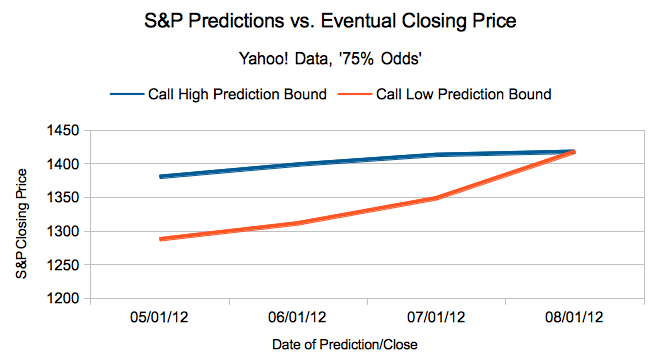
So, you could nail magnitude and direction, but the move you were looking for might happen in September when you bought the June contract. Let's concentrate on one of those parameters, 'Timeframe'. Take a look at this graph:
Options Time Decay in Our S&P Prediction/Pain Model
Now, the average person may be an investor nowadays, but the average person can't predict the future. You probably aren't prophetic either - but if you are, this graph should give you a good idea of 'when' to make your predictions. Time decay is simply the concept that the value of a prediction is higher the further from the event date.
In the graph above, we have 75% error bars (we defined this way back in the beginning of our series) around where contracts said the index might be going. Notice that the 75% predictions start to converge as we get closer to the real date - the market becomes more 'certain' about where the S&P will close (even though it missed it!). Most of the decline in the value of a contract happens at the end, the last few days or weeks of a contract's life - it hurts to be 'out of the money' at that point in time.
Implications for Options Models
Most options models have to contend with time-decay. Theta, literally "Change in Value over Change in Time", is assumed in most places to be an exponential decline. Using the most famous model in options, Black-Scholes, you can even predict time decay using a normal distribution (if you follow the link, the normal distribution is the N()).
Since our model uses snapshots at certain points in time, we can simply graph it. We'll continue to look at the model in more detail in the coming weeks.
