
"I am a great believer in luck, and I find the harder I work, the more I have of it." - Thomas Jefferson
Back in 2011, we wrote a controversial article with a not-that-startling conclusion: breaking respondents to the 2010 CPS down by income brackets, we found that higher earners averaged many more hours of weekly work.
Since we've recently been breaking down 2013 CPS data among similar lines, including drawing a cutoff point at full time work (40 hours a week), we decided to revisit that piece with another article... written from the opposite perspective.
How Your Number of Hours Worked Affects Your Income in America
This data splits respondents by the number of hours they typically work in a week, and does so to a fine granularity. Since there is plenty of data for people right at that magic '40' number, we were able to break it off into its own category - but this data also shows exactly how incomes break down for people who work a lot less... and, of course, a lot more.
Here are the criteria that go into the calculations:
- Total personal income (wage income, plus business income, transfer payments, investment income, etc.)
- Reported working at least 1 hour weekly in 2013 Current Population Survey
- At least 18 years old
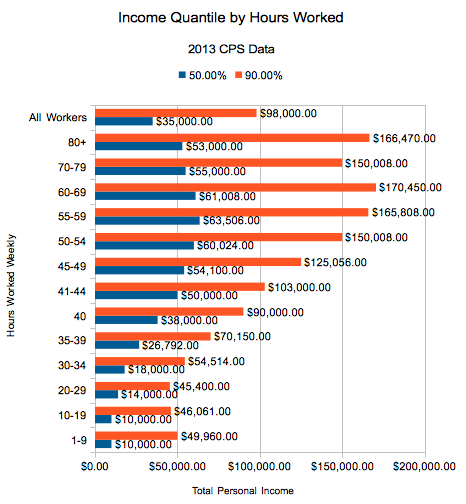 Not too shocking, is it? The more you work, the more income you earn - both at the median, 50th quantile... and at the top decile, 90th quantile. Interestingly, median incomes peak between 55 and 59 hours a week, while you find working 60-69 hours maximizes the 9th decile.
We broke it down even further, because we know that even if this data isn't shocking... it's still interesting. So, here you go, all the data that's fit to print: in convenient, printable table format!
| Income Quantile | ||||||
| Weekly Hours | 10.00% | 25.00% | 50.00% | 75.00% | 90.00% | 99.00% |
| 1-9 | $661.00 | $2,800.00 | $10,000.00 | $25,600.00 | $49,960.00 | $176,926.00 |
| 10-19 | $1,900.00 | $4,500.00 | $10,000.00 | $23,329.00 | $46,061.00 | $170,025.00 |
| 20-29 | $3,600.00 | $8,000.00 | $14,000.00 | $25,000.00 | $45,400.00 | $140,999.00 |
| 30-34 | $5,500.00 | $11,084.00 | $18,000.00 | $30,023.00 | $54,514.00 | $156,000.00 |
| 35-39 | $10,000.00 | $16,492.00 | $26,792.00 | $45,000.00 | $70,150.00 | $180,646.00 |
| 40 | $15,000.00 | $24,084.00 | $38,000.00 | $60,000.00 | $90,000.00 | $200,169.00 |
| 41-44 | $20,000.00 | $32,000.00 | $50,000.00 | $73,000.00 | $103,000.00 | $195,020.00 |
| 45-49 | $20,810.00 | $35,015.00 | $54,100.00 | $83,005.00 | $125,056.00 | $282,000.00 |
| 50-54 | $21,696.00 | $37,600.00 | $60,024.00 | $95,001.00 | $150,008.00 | $480,400.00 |
| 55-59 | $26,470.00 | $40,020.00 | $63,506.00 | $100,600.00 | $165,808.00 | $482,289.00 |
| 60-69 | $20,750.00 | $36,030.00 | $61,008.00 | $100,643.00 | $170,450.00 | $561,685.00 |
| 70-79 | $18,599.00 | $31,000.00 | $55,000.00 | $90,550.00 | $150,008.00 | $902,750.00 |
| 80+ | $13,500.00 | $30,000.00 | $53,000.00 | $90,125.00 | $166,470.00 | $659,498.00 |
| All Workers | $9,160.00 | $19,176.00 | $35,000.00 | $60,009.00 | $98,000.00 | $253,500.00 |
Source
We downloaded the CPS microdata from the University of Minnesota’s Minnesota Population Center’s IPUMS-CPS site.
Miriam King, Steven Ruggles, J. Trent Alexander, Sarah Flood, Katie Genadek, Matthew B. Schroeder, Brandon Trampe, and Rebecca Vick. Integrated Public Use Microdata Series, Current Population Survey: Version 3.0. [Machine-readable database]. Minneapolis: University of Minnesota, 2010.
Work Harder, Create Luck!
There are 168 hours in a week, and, yes, there is a tradeoff between the amount of money you make and the number of hours you spend not making money. This article hopefully gives you an idea of what working more means across the economy... although I don't quite know why the numbers break down once you hit 80+ hours (working theory: that's probably mostly young folks with mostly wage income, versus experienced folks filling in the gap with investments. Do you know any 50 year old investment bankers?).
So... does this break down roughly as you expected? Does it suggest we live in a meritocracy, or at least something that if you squint sort of approximates one? Does this seem unfair? Let us hear your reactions, we'd love to get your take!
