
We previously showed there isn't a strong correlation of income and net worth in America. While writing that post we posed you a question: if income isn't the best input to describe net worth, what can improve it? To wit, there's a very important factor we should include: let's look at the correlation of income and net worth by age.
Age vs. the Income and Net Worth Correlation
And, indeed - age does affect the measures. But even when grouping by age there isn't a strong correlation outside of households headed by a 30-34 or 45-49 year old. Yes, the results we got are weird indeed...
Quoting the above linked article, the correlation of income net worth in America in 2016 was .5069, for an R^2 of .2569.
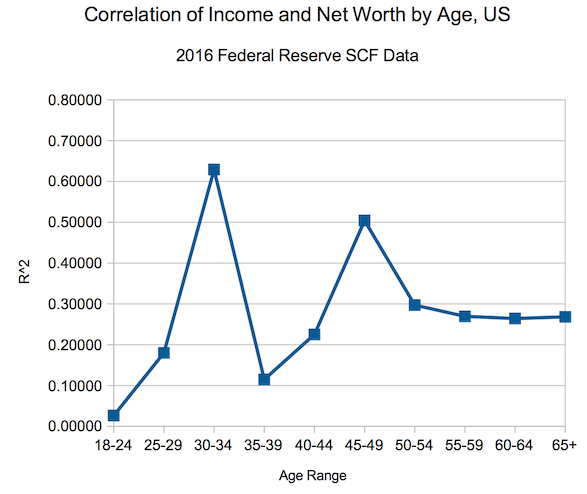
Using the same age breakdowns we used in the net worth by age calculator, we found that subgroups varied from a correlation of .1620 to .7931 (R^2 between a nearly non-existent .0262 and decent .6290).
| Age Range | R^2 | R |
| 18-24 | 0.02624 | 0.16199 |
| 25-29 | 0.18005 | 0.42432 |
| 30-34 | 0.62904 | 0.79312 |
| 35-39 | 0.11481 | 0.33884 |
| 40-44 | 0.22518 | 0.47453 |
| 45-49 | 0.50429 | 0.71013 |
| 50-54 | 0.29703 | 0.54501 |
| 55-59 | 0.26951 | 0.51914 |
| 60-64 | 0.26422 | 0.51403 |
| 65+ | 0.26829 | 0.51797 |
In graphical form, here's how it looks:
Unlike in our 2013 article, there's not really a good narrative for these calculations. (At least to our minds...)
If we matched the 2013 narrative the R^2 for households with heads aged 35-44 would be much higher. If the lifecycle story held true, income would better describe net worth early in a career.
Older households would see a falloff as a householder grew older and other factors grew dominant. Instead, the above graph looks mainly like noise.
Graphs of Income and Net Worth by Age
We made visualizations for the correlation of income and net worth across al the age groups we examined today.
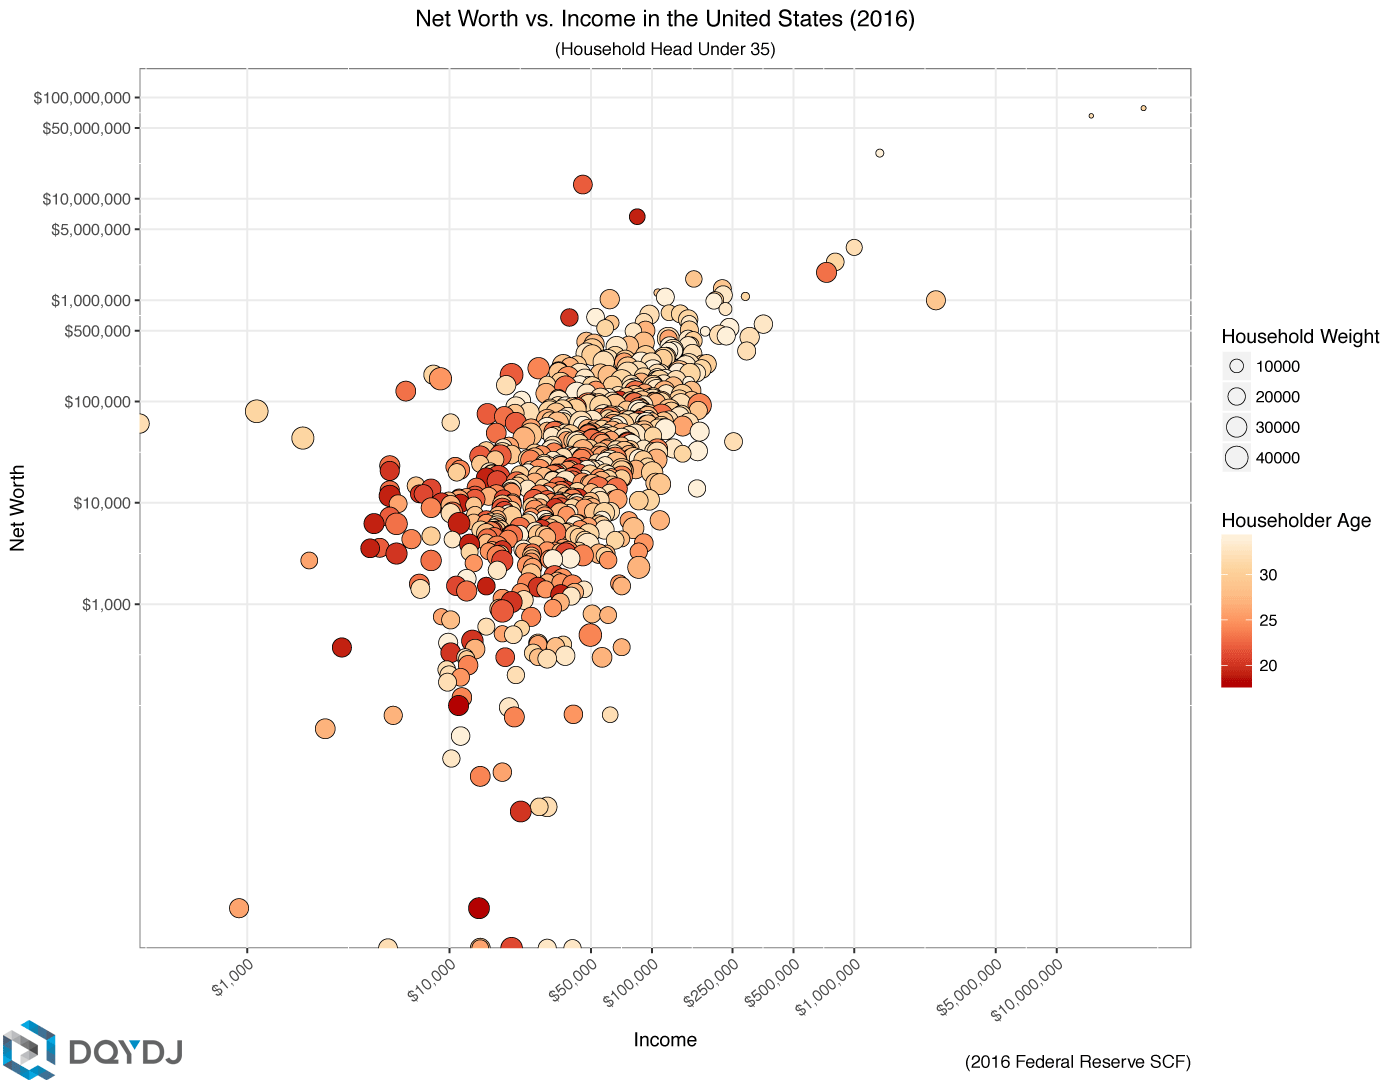
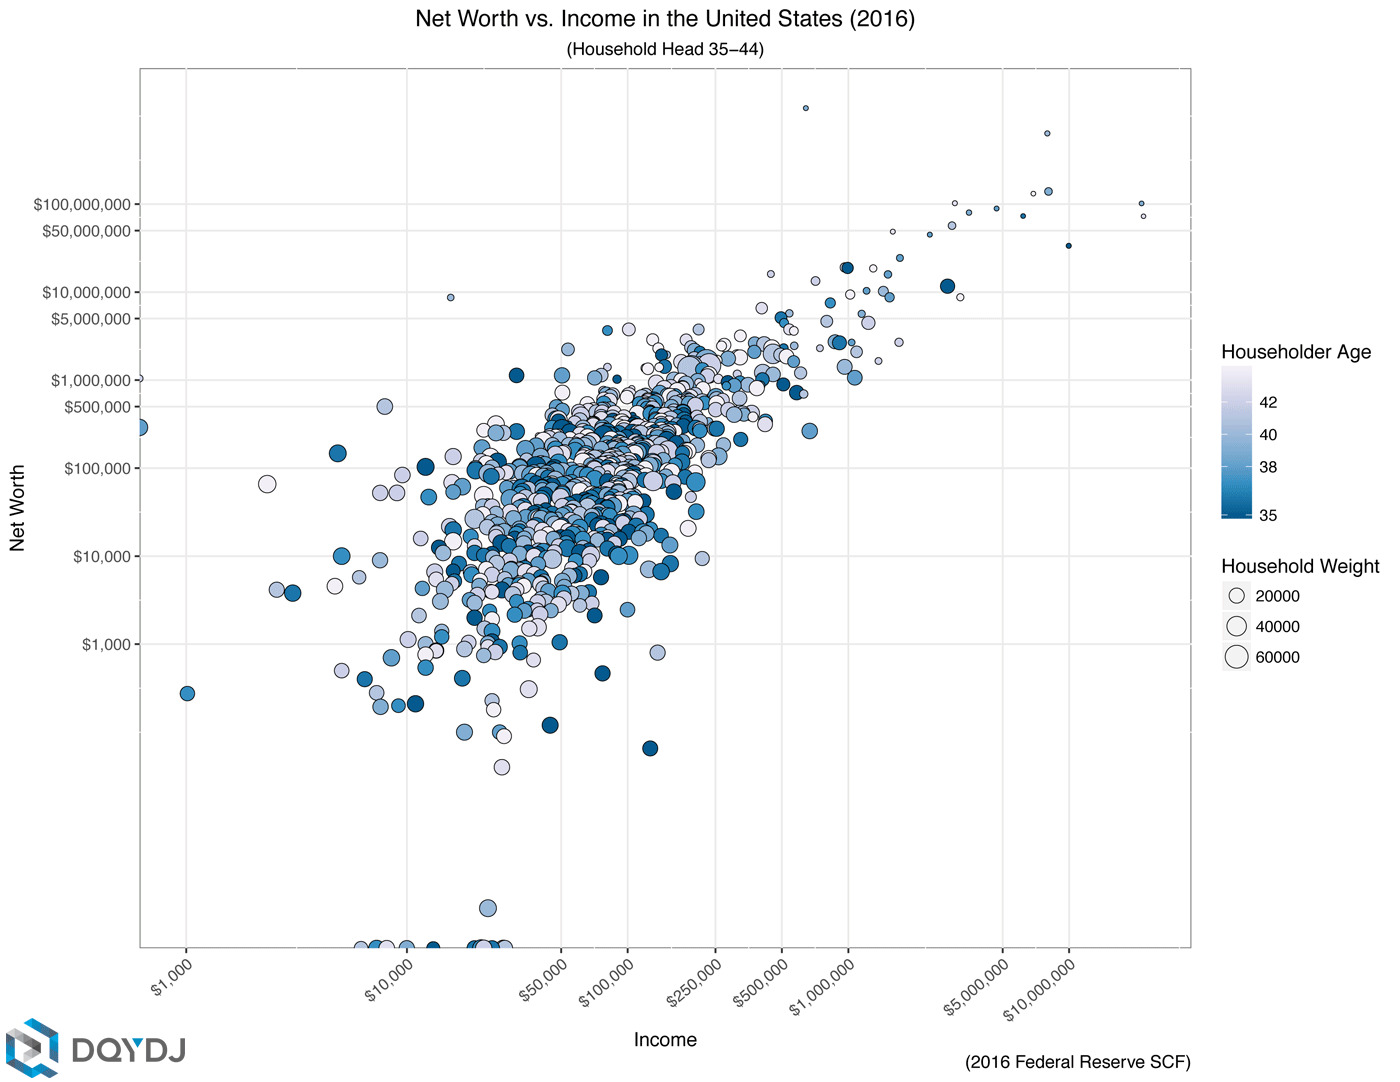
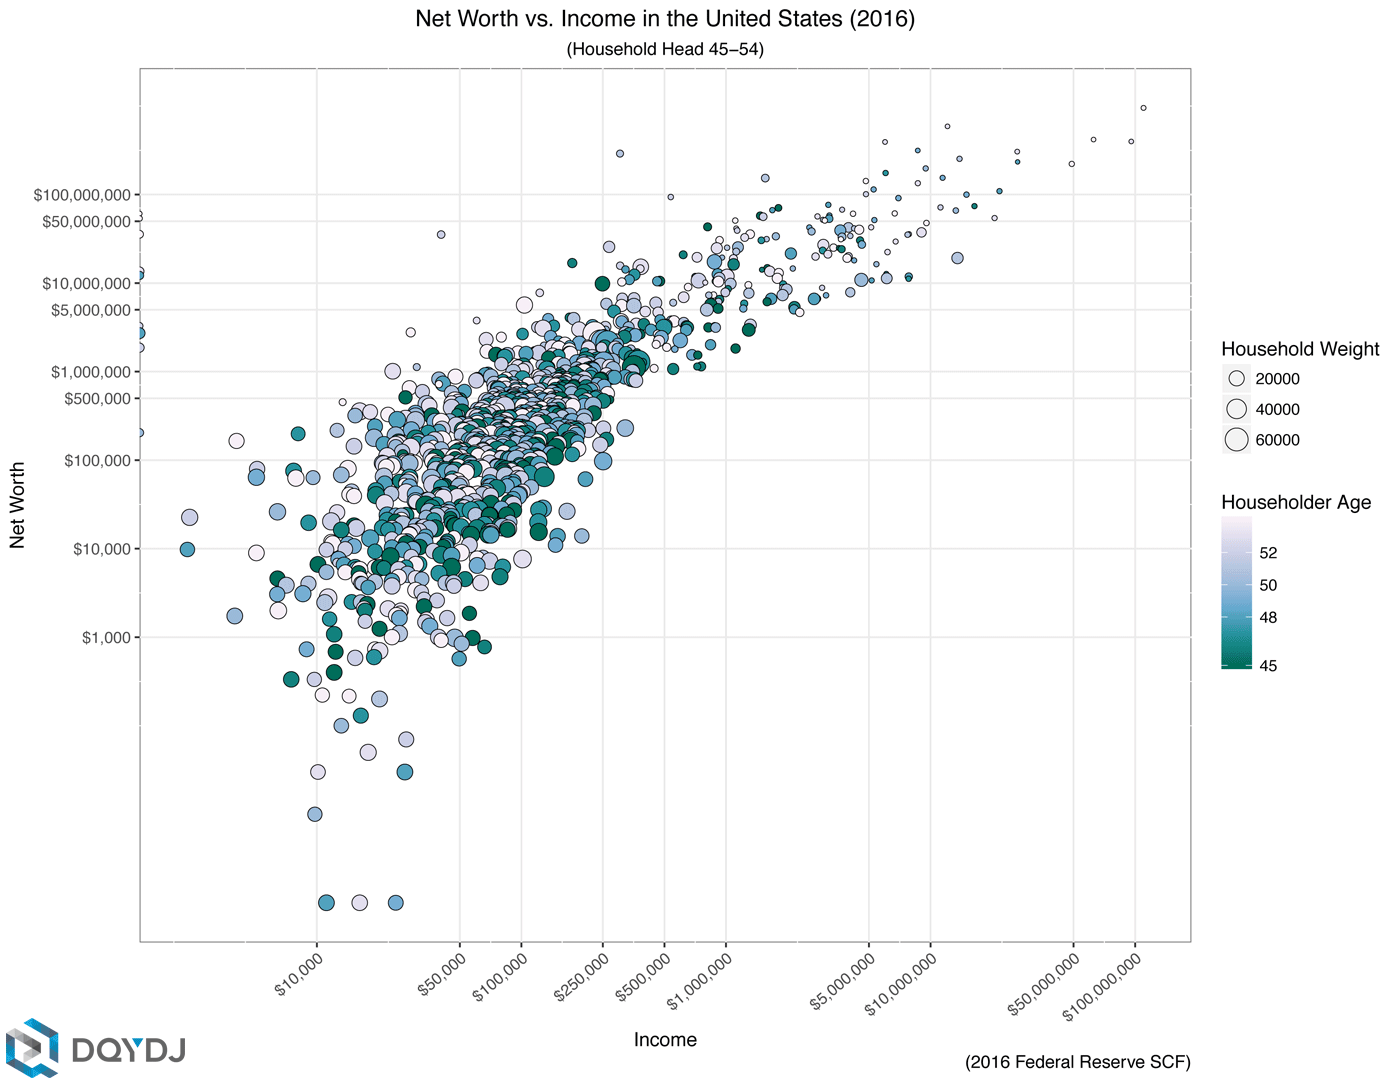
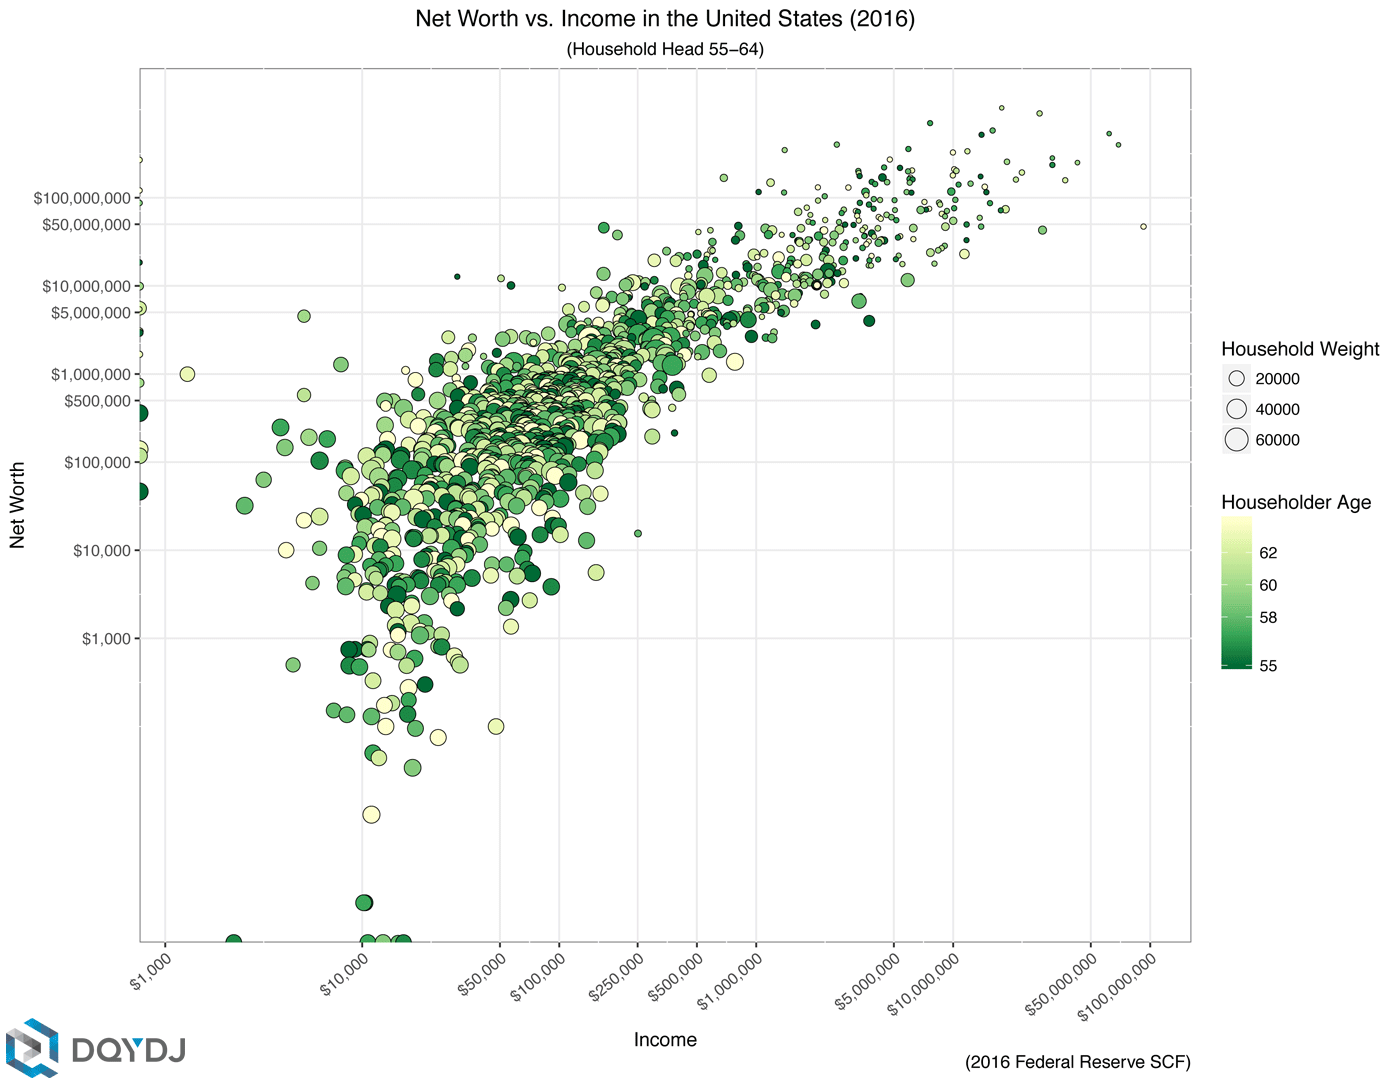
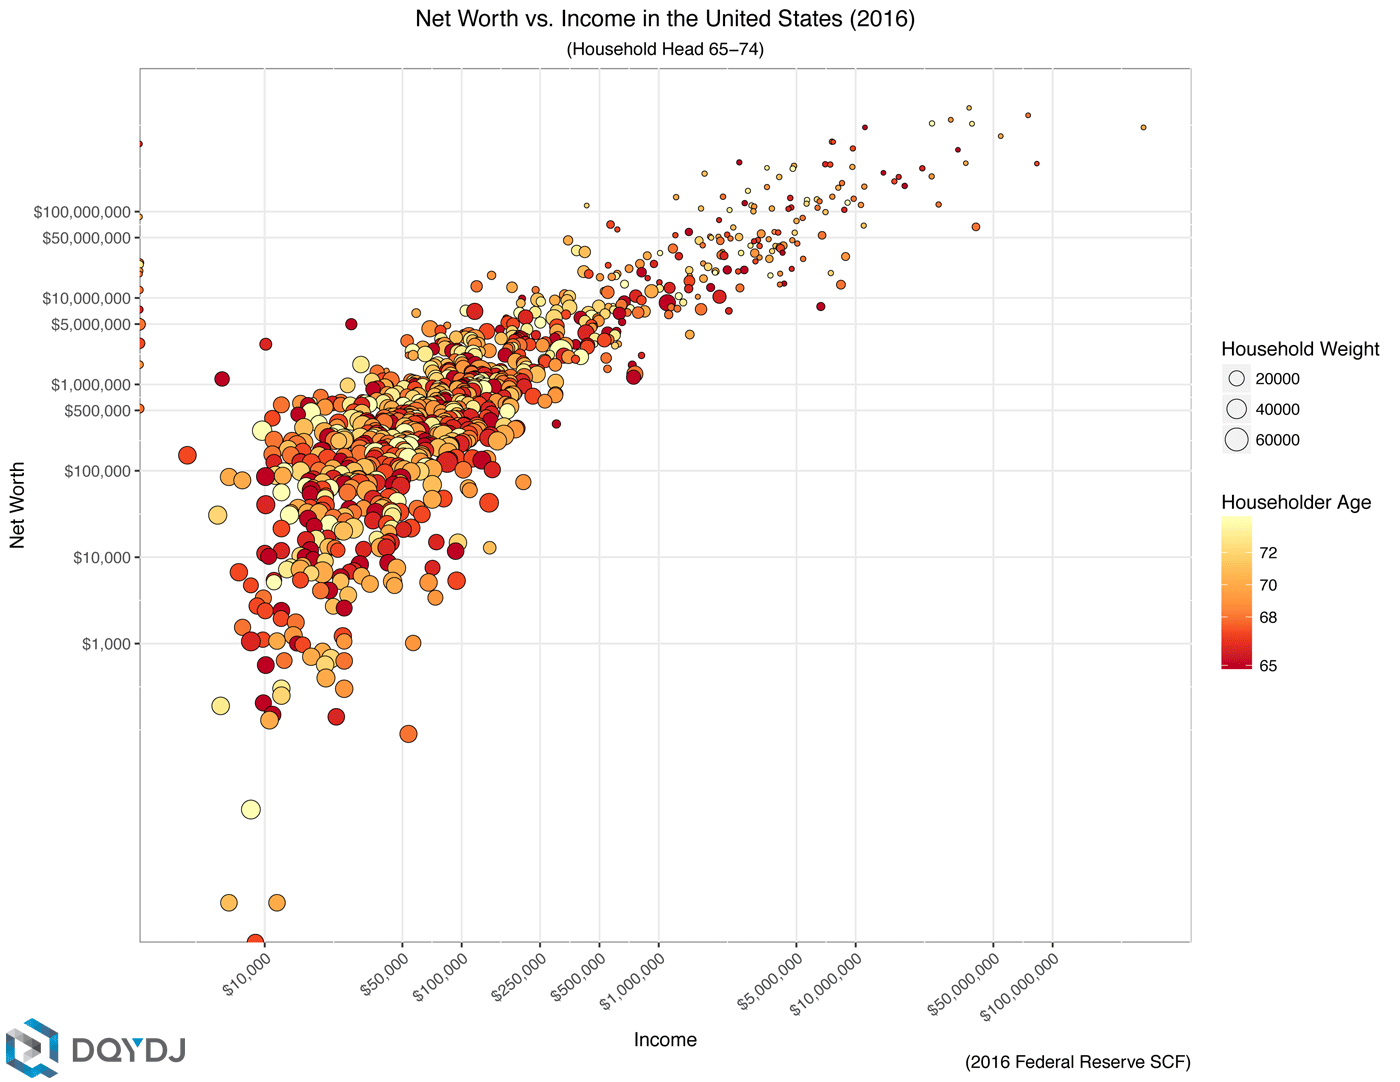
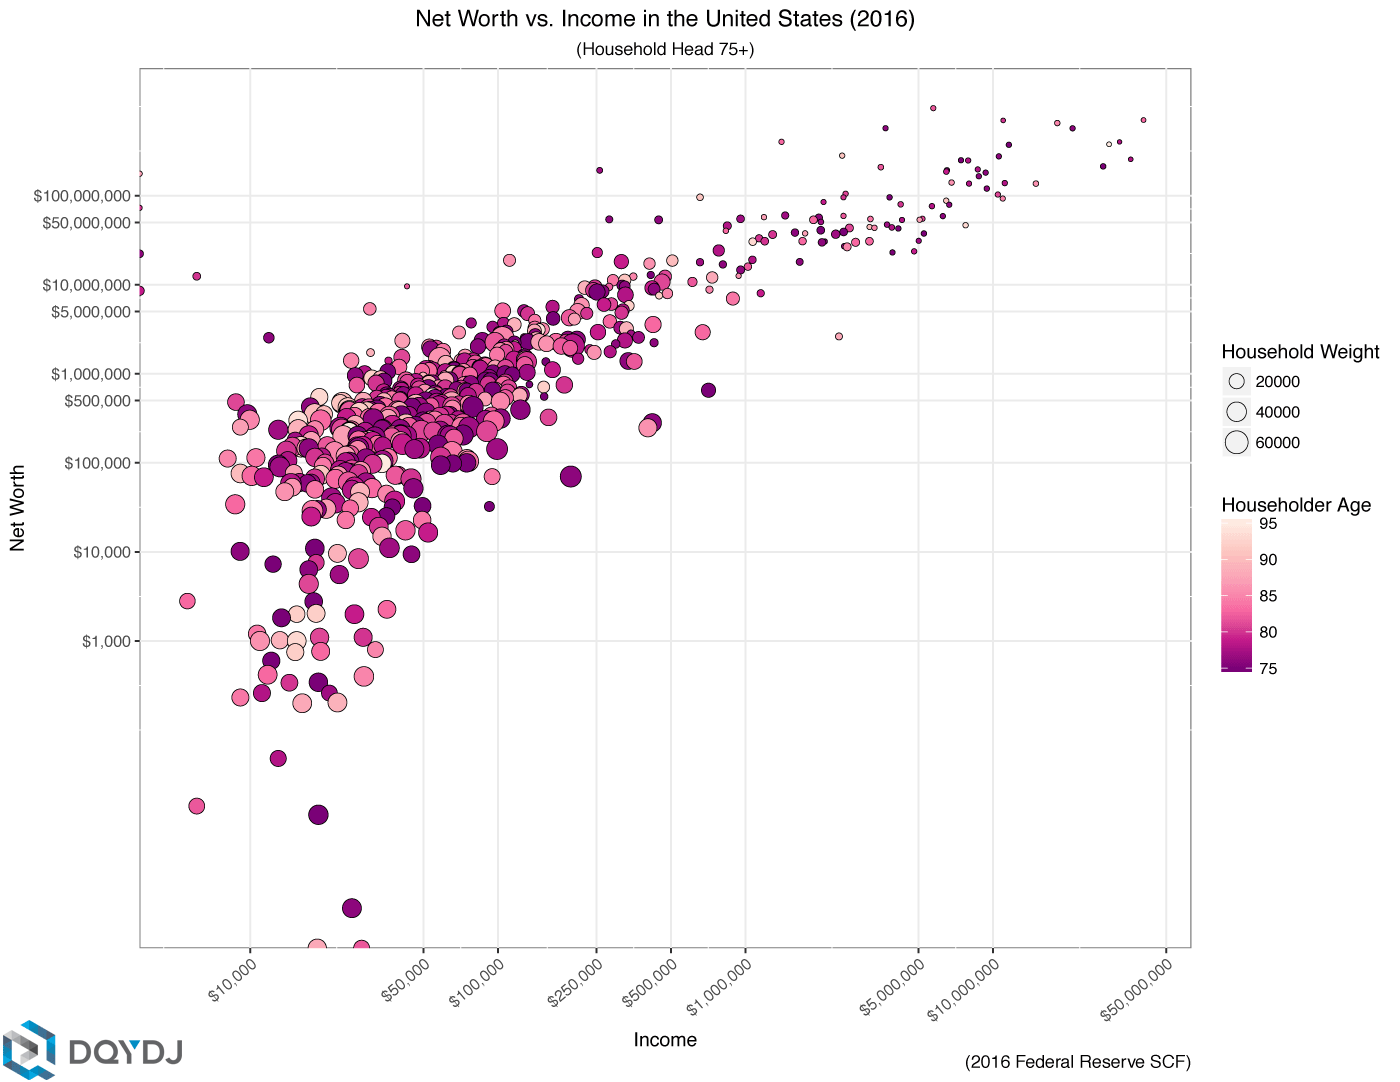
The size of the point shows how many households it represents. The color is the age of the head of household. Income is on the x-axis and net worth is on the y-axis.
(For any of the six, click to zoom in.)
Households with Head Under 35
35-44 Year Old Householder
Households with Head Under 45-54
Householder 55-64
Households with Head 65-74
Household Head 75 and Up
Methodology and Source on the Correlation Of Income and Net Worth by Age
As in other posts, we start with the 2016 SCF Data from the Federal Reserve, and export all 5 imputed data sets. We take a weighted average for each to estimate the original sample.
(See the correlation of income and net worth by age post and the correlation of income and net worth for the upper middle class post for more details on the process.)
After that, it's straightforward - split by age groups and make the same calculations from the past articles.
Conclusions on Income and Net Worth Correlations by Age
Income should affect net worth - there is definitely causation here. All of these articles suggest that income isn't an overwhelming factor in net worth, though. There's something else there - age and time in the markets matter, sure, but also propensity to save, diligence, motivation and (yes) luck.
This data isn't longitudinal, so we only have a one year snapshot and are limited in what we can measure. That in mind, if you can think of another way to slice this, let us know - otherwise we're going to leave the correlations alone for the 2016 data. Next we'll try to figure out how best to present budgets for various incomes through the SCF - wish us luck.
