
On this page I estimate United States Individual Income Brackets for 2019. I also calculate the average, median, and top 1% of individual incomes in the United States.
Individual incomes here are limited to Americans who worked (or wanted to work) in 2018. Incomes are earned between January and December 2018. Alternatively, compare incomes in the individual income percentile calculator.
We also have research on household incomes.
Individual Income Benchmarks in 2019
The most important summary statistics for income are:
- Median income
- Average income
- Top 1% income
What was the median individual income?
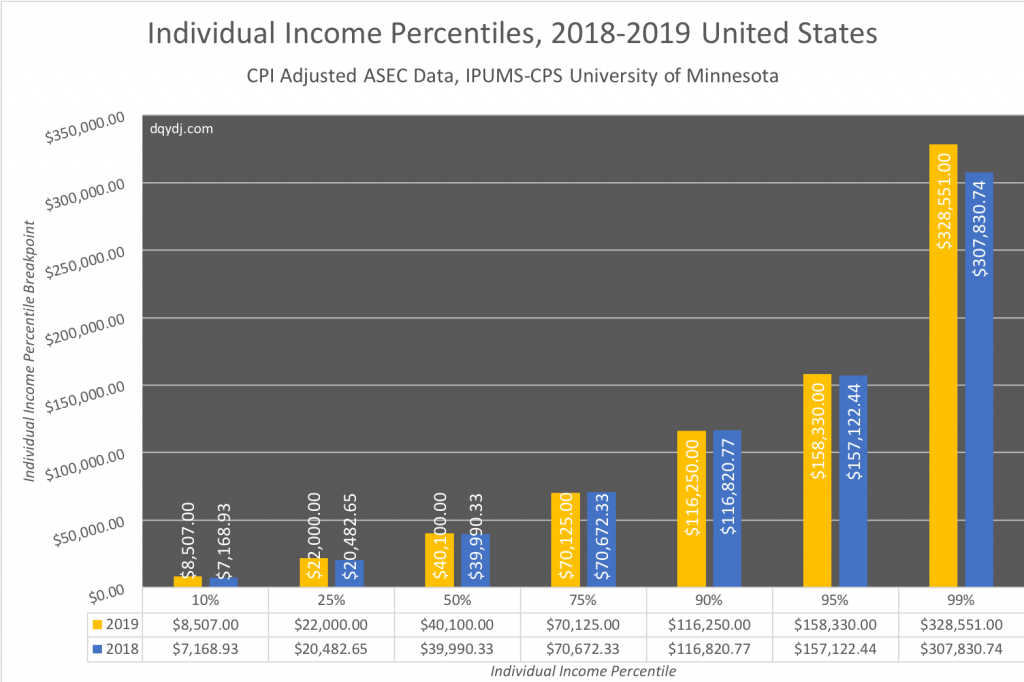
Median individual income was $40,100.00 in 2019 in the United States.
What was the average individual income?
Average individual income in 2019 in the United States was $58,379.45.
What is the top 1% individual income?
The threshold for a US worker to be in the top 1% in 2019 was $328,551.00.
Do you have individual income data by age?
Yes – see our average, median, and top 1% income by age research and the income percentile by age calculator.
Is median income the same as average income?
No, median and average income are not the same. They are different statistical measures:
- Median individual income means half of all individual workers made more, while half made less money in full-year 2018.
- Average individual income means we add up every worker's earnings in full-year 2018 then divide by the number of workers.
We mentioned in the household income article research that median is the most important summary statistic. Especially with something like income, there are wide variations on earnings across workers.
Median is resistant to outliers in a way average isn't – consider that it's possible to make over a billion dollars in a year. If you only look at average the earnings will look higher than "most" people make because income is concentrated - you also see this (really, even worse) with net worth.
Selected United States Individual Income Percentiles for 2019 and 2019
As we showed in the household income research, some of the most interesting comparisons aren't between percentiles – they're between years.
Individual income is defined as all income earned assigned to one individual. Think:
- Wage income
- Business income
- Investment income
- Other income: see the list of all components
I adjusted 2018 individual income numbers to compare year over year as detailed by IPUMS CPS. To do it yourself, multiply 2018 dollar amounts by (.679/.663).
I caution you: this data isn't longitudinal. People move between percentiles from year to year, people enter the workforce (new grads, long time unemployed)... and people leave (unemployment, retirement).
These numbers suggest avenues for further research, but don't necessarily describe the experience of particular people over the last few years.
Comprehensive Individual Income Bracket Comparison 2018 vs. 2019
When I looked at the household income comparison, I told you 52% of household income breakpoints increased – a slight majority.
Surprisingly, a full 83.8% of individual income centiles (well, ""centile breakpoints"") increased in 2019 vs. 2018.
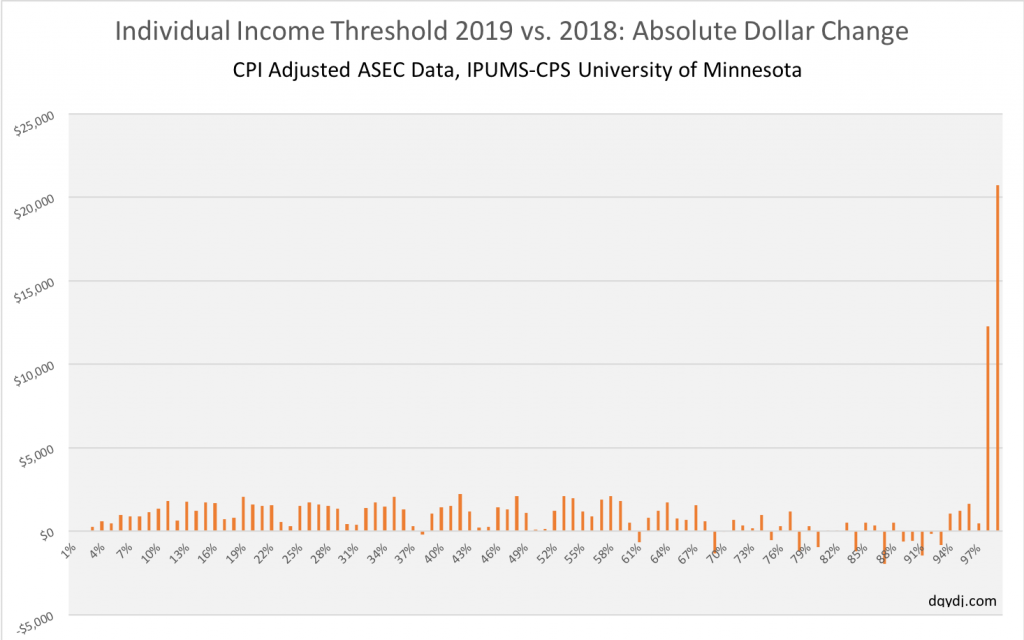
It goes to show you never can tell how individual incomes interact with households. Just as individuals enter and exit the workforce, households form and dissolve.
2019 Individual Income Percentiles for the United States
To recap, the summary statistics for individual earners:
- Top 1%: $328,551.00
- Median individual income: $40,100.00
- Average individual income: $58,379.45
Adjusted for inflation (CPI), top 1% and median were up 6.73% and .27%, respectively. Average individual income, CPI-adjusted, was up 2.01% in 2019.
| Individual Income Percentile | 2019 | 2018 | Percentage Increase | Absolute Increase |
| 1.00% | $0.00 | $0.00 | 0.00% | $0.00 |
| 2.00% | $0.00 | $0.00 | 0.00% | $0.00 |
| 3.00% | $301.00 | $51.21 | 487.81% | $249.79 |
| 4.00% | $1,500.00 | $921.72 | 62.74% | $578.28 |
| 5.00% | $2,500.00 | $2,015.49 | 24.04% | $484.51 |
| 6.00% | $3,800.00 | $2,808.17 | 35.32% | $991.83 |
| 7.00% | $5,000.00 | $4,096.53 | 22.05% | $903.47 |
| 8.00% | $6,000.00 | $5,120.66 | 17.17% | $879.34 |
| 9.00% | $7,303.00 | $6,144.80 | 18.85% | $1,158.20 |
| 10.00% | $8,507.00 | $7,168.93 | 18.66% | $1,338.07 |
| 11.00% | $10,000.00 | $8,193.06 | 22.05% | $1,806.94 |
| 12.00% | $10,379.00 | $9,729.26 | 6.68% | $649.74 |
| 13.00% | $12,000.00 | $10,242.35 | 17.16% | $1,757.65 |
| 14.00% | $12,480.00 | $11,267.51 | 10.76% | $1,212.49 |
| 15.00% | $14,000.00 | $12,289.59 | 13.92% | $1,710.41 |
| 16.00% | $15,000.00 | $13,313.73 | 12.67% | $1,686.27 |
| 17.00% | $15,050.00 | $14,338.88 | 4.96% | $711.12 |
| 18.00% | $16,154.00 | $15,361.99 | 5.16% | $792.01 |
| 19.00% | $17,509.00 | $15,464.40 | 13.22% | $2,044.60 |
| 20.00% | $18,020.00 | $16,410.70 | 9.81% | $1,609.30 |
| 21.00% | $19,104.00 | $17,572.07 | 8.72% | $1,531.93 |
| 22.00% | $20,000.00 | $18,435.41 | 8.49% | $1,564.59 |
| 23.00% | $20,001.00 | $19,460.57 | 2.78% | $540.43 |
| 24.00% | $20,800.00 | $20,482.65 | 1.55% | $317.35 |
| 25.00% | $22,000.00 | $20,482.65 | 7.41% | $1,517.35 |
| 26.00% | $22,804.00 | $21,077.68 | 8.19% | $1,726.32 |
| 27.00% | $23,825.00 | $22,222.66 | 7.21% | $1,602.34 |
| 28.00% | $24,251.00 | $22,752.13 | 6.59% | $1,498.87 |
| 29.00% | $25,000.00 | $23,657.47 | 5.67% | $1,342.53 |
| 30.00% | $25,006.00 | $24,580.21 | 1.73% | $425.79 |
| 31.00% | $26,000.00 | $25,603.32 | 1.55% | $396.68 |
| 32.00% | $27,000.00 | $25,604.34 | 5.45% | $1,395.66 |
| 33.00% | $28,000.00 | $26,273.10 | 6.57% | $1,726.90 |
| 34.00% | $28,600.00 | $27,122.11 | 5.45% | $1,477.89 |
| 35.00% | $30,000.00 | $27,934.24 | 7.40% | $2,065.76 |
| 36.00% | $30,000.00 | $28,682.89 | 4.59% | $1,317.11 |
| 37.00% | $30,002.00 | $29,717.26 | 0.96% | $284.74 |
| 38.00% | $30,525.00 | $30,723.98 | -0.65% | -$198.98 |
| 39.00% | $31,800.00 | $30,725.01 | 3.50% | $1,074.99 |
| 40.00% | $32,300.00 | $30,865.31 | 4.65% | $1,434.69 |
| 41.00% | $33,502.00 | $31,966.25 | 4.80% | $1,535.75 |
| 42.00% | $35,000.00 | $32,779.42 | 6.77% | $2,220.58 |
| 43.00% | $35,000.00 | $33,806.62 | 3.53% | $1,193.38 |
| 44.00% | $35,360.00 | $35,127.75 | 0.66% | $232.25 |
| 45.00% | $36,107.00 | $35,844.65 | 0.73% | $262.35 |
| 46.00% | $37,300.00 | $35,875.37 | 3.97% | $1,424.63 |
| 47.00% | $38,175.00 | $36,868.78 | 3.54% | $1,306.22 |
| 48.00% | $39,977.00 | $37,894.96 | 5.49% | $2,082.04 |
| 49.00% | $40,000.00 | $38,919.09 | 2.78% | $1,080.91 |
| 50.00% | $40,100.00 | $39,990.33 | 0.27% | $109.67 |
| 51.00% | $41,120.00 | $40,965.31 | 0.38% | $154.69 |
| 52.00% | $42,202.00 | $40,975.55 | 2.99% | $1,226.45 |
| 53.00% | $43,690.00 | $41,579.79 | 5.08% | $2,110.21 |
| 54.00% | $45,000.00 | $43,013.57 | 4.62% | $1,986.43 |
| 55.00% | $45,211.00 | $44,037.71 | 2.66% | $1,173.29 |
| 56.00% | $46,470.00 | $45,573.91 | 1.97% | $896.09 |
| 57.00% | $48,000.00 | $46,089.05 | 4.15% | $1,910.95 |
| 58.00% | $49,010.00 | $46,898.11 | 4.50% | $2,111.89 |
| 59.00% | $50,000.00 | $48,193.64 | 3.75% | $1,806.36 |
| 60.00% | $50,010.00 | $49,501.46 | 1.03% | $508.54 |
| 61.00% | $50,545.00 | $51,206.64 | -1.29% | -$661.64 |
| 62.00% | $52,000.00 | $51,214.83 | 1.53% | $785.17 |
| 63.00% | $53,026.00 | $51,821.12 | 2.33% | $1,204.88 |
| 64.00% | $55,000.00 | $53,255.93 | 3.27% | $1,744.07 |
| 65.00% | $55,510.00 | $54,729.65 | 1.43% | $780.35 |
| 66.00% | $57,006.00 | $56,328.32 | 1.20% | $677.68 |
| 67.00% | $58,908.00 | $57,351.43 | 2.71% | $1,556.57 |
| 68.00% | $60,000.00 | $59,399.70 | 1.01% | $600.30 |
| 69.00% | $60,106.00 | $61,447.96 | -2.18% | -$1,341.96 |
| 70.00% | $61,455.00 | $61,468.45 | -0.02% | -$13.45 |
| 71.00% | $63,300.00 | $62,625.72 | 1.08% | $674.28 |
| 72.00% | $65,003.00 | $64,654.52 | 0.54% | $348.48 |
| 73.00% | $66,760.00 | $66,574.77 | 0.28% | $185.23 |
| 74.00% | $69,101.00 | $68,134.53 | 1.42% | $966.47 |
| 75.00% | $70,125.00 | $70,672.33 | -0.77% | -$547.33 |
| 76.00% | $72,020.00 | $71,730.26 | 0.40% | $289.74 |
| 77.00% | $74,953.00 | $73,784.67 | 1.58% | $1,168.33 |
| 78.00% | $75,651.00 | $76,809.95 | -1.51% | -$1,158.95 |
| 79.00% | $78,146.00 | $77,839.21 | 0.39% | $306.79 |
| 80.00% | $80,018.00 | $80,957.69 | -1.16% | -$939.69 |
| 81.00% | $82,076.00 | $82,063.76 | 0.01% | $12.24 |
| 82.00% | $85,049.00 | $85,003.02 | 0.05% | $45.98 |
| 83.00% | $88,113.00 | $87,594.07 | 0.59% | $518.93 |
| 84.00% | $90,521.00 | $91,711.09 | -1.30% | -$1,190.09 |
| 85.00% | $94,750.00 | $94,220.21 | 0.56% | $529.79 |
| 86.00% | $98,902.00 | $98,547.17 | 0.36% | $354.83 |
| 87.00% | $100,478.00 | $102,416.35 | -1.89% | -$1,938.35 |
| 88.00% | $105,002.00 | $104,497.38 | 0.48% | $504.62 |
| 89.00% | $110,010.00 | $110,629.89 | -0.56% | -$619.89 |
| 90.00% | $116,250.00 | $116,820.77 | -0.49% | -$570.77 |
| 91.00% | $121,500.00 | $122,936.89 | -1.17% | -$1,436.89 |
| 92.00% | $129,002.00 | $129,144.16 | -0.11% | -$142.16 |
| 93.00% | $137,542.00 | $138,356.24 | -0.59% | -$814.24 |
| 94.00% | $150,000.00 | $148,952.94 | 0.70% | $1,047.06 |
| 95.00% | $158,330.00 | $157,122.44 | 0.77% | $1,207.56 |
| 96.00% | $176,000.00 | $174,348.36 | 0.95% | $1,651.64 |
| 97.00% | $200,300.00 | $199,808.30 | 0.25% | $491.70 |
| 98.00% | $243,500.00 | $231,234.83 | 5.30% | $12,265.17 |
| 99.00% | $328,551.00 | $307,830.74 | 6.73% | $20,720.26 |
Methodology on 2019 United States Household Income Brackets
I source this data from the United States Census Bureau's Annual ASEC survey, released in September 2019. I use harmonized data from the University of Minnesota's Minnesota Population Center in R (thanks for making it easy for this engineer!).
Sarah Flood, Miriam King, Renae Rodgers, Steven Ruggles and J. Robert Warren. Integrated Public Use Microdata Series, Current Population Survey: Version 6.0 [dataset]. Minneapolis, MN: IPUMS, 2019. https://doi.org/10.18128/D030.V6.0
How can I cite your individual income data?
Feel free to quote an excerpt from the data and link here. Cite "Don't Quit Your Day Job..." or "DQYDJ" (dealer's choice!).
Also be certain to include the IPUMS citation in the previous section.
What is your 'worker' screen?
Because of many arguments over the years of doing this particular post, we've converged on an acceptable definition of workforce: people who are:
- At least the age of 16
- Labeled as 'in workforce'
- Report working 1 or more hours in a typical week
- Report 'want' or 'maybe want' a job
How does this compare to the employment population ratio?
Because we are adding people who were in the workforce in a year plus people who 'want' and 'maybe want' a job our screen is more broad than the workforce measure. Specifically, it bumps our screen from ~64.5% of over 16s to ~67.5%.
Both measures are greater than a snapshot of employment to population in an individual month (see the current snapshot on FRED here). That's merely a side effect of a 12 month period versus a snapshot.
Either way, this is a good screen. I cut it further for typical hours (but not a minimum weeks in year) worked in the individual income percentile calculator post.
Why don't these numbers match the Social Security Administration's earnings statistics?
The ASEC numbers are the gold standard estimates of income and poverty in the United States.
Seriously: the ASEC is the survey supplement where the Census Bureau creates the official poverty estimates for the United States. The numbers include all types of income including investment income. They don't only include income where you would owe OASDI.
The highest earners every year have material income from multiple sources. Yet every year I hear arguments about the SSA data – let's keep it to all income forms this year (🤞)?
How many samples are in the 2019 and 2018 data?
- 2019: 93,939 data-points representing an estimated 174,279,931 American workers.
- 2018: 93,820 data-points representing an estimated 173,874,158 American workers.
Is individual income gross or net?
All income numbers in this post are gross income, or before tax. The 2018 numbers are adjusted for CPI using the numbers in IPUMS' instructions.
Can you compare this individual income data year over year?
This data is not longitudinal.
This means that it is a different set of people answering the survey than last year. The numbers I'm summarizing do not prove anything about how individuals – or households – have performed year over year.
See the above note - you can take strong hints from this data about where to research next. However, as a snapshot you can't say anything about how individuals did year over year.
I'll guess your next question: the University of Michigan's PSID is a longitudinal income study.
Analysis of Individual Income Brackets in 2019
It's one thing to talk theoretically about household construction versus individual earnings, but this year's data really proves the value of our caution. 84% of individual income percentiles increased year over year, while "only" 52% of household income percentiles did the same.
See past editions of the average, median, and top 1% individual income post:
How did your income change from 2018 to 2019? How's 2020 tracking? When's the next recession?
