

On this page we've estimated Individual United States Income Brackets for 2018. This data is for individuals in the United States, including income earned between January and December of 2017. We also include a table of every individual income percentile for 2018 United States data.
Also see our research on household incomes.
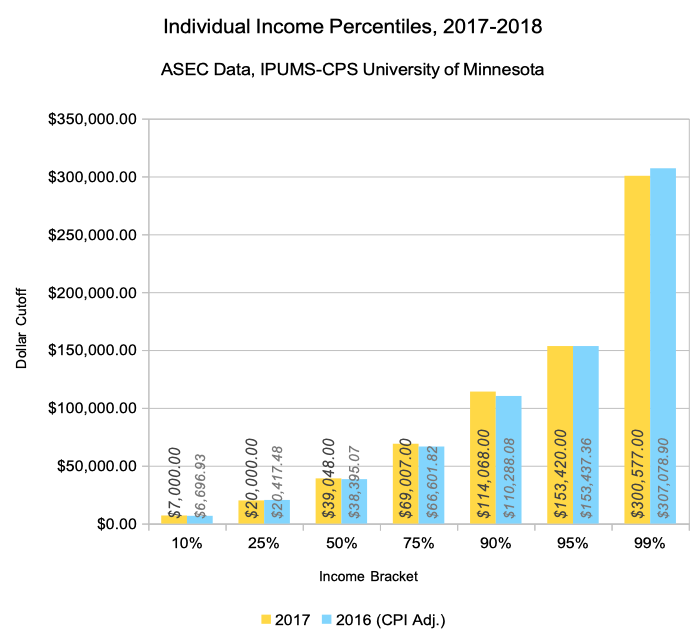
Selected Individual United States Income Brackets for 2018 and 2017
We estimated the breakpoints for the 10th, 25th, 50th (median), 75th, 90th, 95th, and 99th percentile of United States individual income earners.
Income is defined as all income earned from any source not just from a primary job!
This can be:
- Wage income (including multiple jobs)
- Business income
- Investment income
- Other income: see the full list of sources.
Individual Income Bracket Comparisons Across Years
There's a very important fact to keep in mind while examining the data: it is not longitudinal. Do not draw any conclusions about the performance of individuals from this data. Individuals move up and down in the spectrum, but you can't guess at income history. Additionally, the size of the workforce changes as people take breaks, retire, or otherwise leave or start jobs.
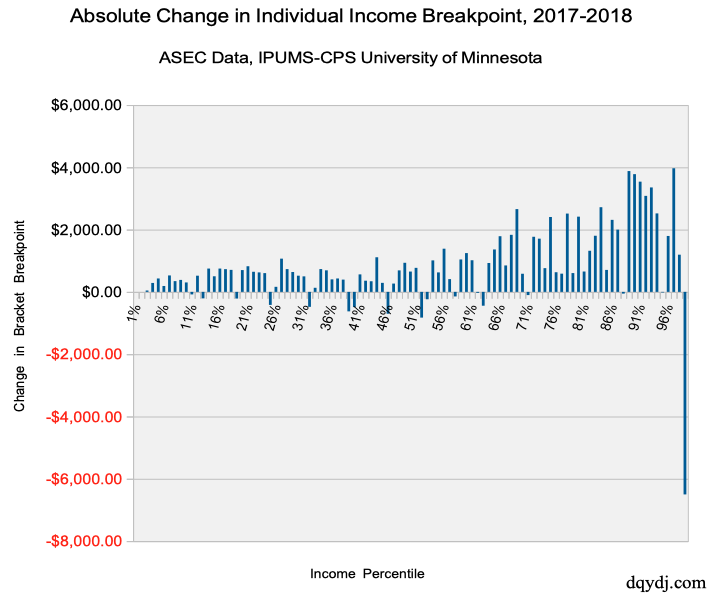
Putting all that aside, individual income brackets were mostly increased across the board (inflation adjusted). We also estimate that (adjusted for CPI), it was $6,501.90 easier to be a 1%er in 2017 than in 2016.
Every Individual Income Percentile for the United States in 2018
Median individual income was $39,400.00 in 2017, and the threshold for a US individual to be top 1% was $300,577.00. Inflation adjusted, those breakpoints were up +1.70% and down -2.12%. Average individual income in 2018 in the United States was $55,880.28.
| 2017 | 2016 (CPI Adj.) | Percentage Increase | Absolute Increase | |
| 1.00% | $0.00 | $0.00 | 0.00% | $0.00 |
| 2.00% | $0.00 | $0.00 | 0.00% | $0.00 |
| 3.00% | $50.00 | $5.10 | 880.39% | $44.90 |
| 4.00% | $900.00 | $612.52 | 46.93% | $287.48 |
| 5.00% | $1,968.00 | $1,537.44 | 28.00% | $430.56 |
| 6.00% | $2,742.00 | $2,552.19 | 7.44% | $189.81 |
| 7.00% | $4,000.00 | $3,470.97 | 15.24% | $529.03 |
| 8.00% | $5,000.00 | $4,654.16 | 7.43% | $345.84 |
| 9.00% | $6,000.00 | $5,614.81 | 6.86% | $385.19 |
| 10.00% | $7,000.00 | $6,696.93 | 4.53% | $303.07 |
| 11.00% | $8,000.00 | $8,081.24 | -1.01% | -$81.24 |
| 12.00% | $9,500.00 | $8,979.61 | 5.80% | $520.39 |
| 13.00% | $10,001.00 | $10,208.74 | -2.03% | -$207.74 |
| 14.00% | $11,002.00 | $10,252.64 | 7.31% | $749.36 |
| 15.00% | $12,000.00 | $11,499.12 | 4.36% | $500.88 |
| 16.00% | $13,000.00 | $12,250.49 | 6.12% | $749.51 |
| 17.00% | $14,001.00 | $13,271.36 | 5.50% | $729.64 |
| 18.00% | $15,000.00 | $14,292.24 | 4.95% | $707.76 |
| 19.00% | $15,100.00 | $15,313.11 | -1.39% | -$213.11 |
| 20.00% | $16,024.00 | $15,323.32 | 4.57% | $700.68 |
| 21.00% | $17,158.00 | $16,333.98 | 5.04% | $824.02 |
| 22.00% | $18,001.00 | $17,354.86 | 3.72% | $646.14 |
| 23.00% | $19,002.00 | $18,375.73 | 3.41% | $626.27 |
| 24.00% | $20,000.00 | $19,396.61 | 3.11% | $603.39 |
| 25.00% | $20,000.00 | $20,417.48 | -2.04% | -$417.48 |
| 26.00% | $20,581.00 | $20,417.48 | 0.80% | $163.52 |
| 27.00% | $21,699.00 | $20,631.86 | 5.17% | $1,067.14 |
| 28.00% | $22,216.00 | $21,484.29 | 3.41% | $731.71 |
| 29.00% | $23,100.00 | $22,461.27 | 2.84% | $638.73 |
| 30.00% | $24,001.00 | $23,480.10 | 2.22% | $520.90 |
| 31.00% | $25,000.00 | $24,500.98 | 2.04% | $499.02 |
| 32.00% | $25,001.00 | $25,481.02 | -1.88% | -$480.02 |
| 33.00% | $25,654.00 | $25,521.85 | 0.52% | $132.15 |
| 34.00% | $26,483.00 | $25,749.50 | 2.85% | $733.50 |
| 35.00% | $27,276.00 | $26,583.56 | 2.60% | $692.44 |
| 36.00% | $28,007.00 | $27,604.43 | 1.46% | $402.57 |
| 37.00% | $29,017.00 | $28,585.49 | 1.51% | $431.51 |
| 38.00% | $30,000.00 | $29,605.35 | 1.33% | $394.65 |
| 39.00% | $30,001.00 | $30,626.22 | -2.04% | -$625.22 |
| 40.00% | $30,138.00 | $30,626.22 | -1.59% | -$488.22 |
| 41.00% | $31,213.00 | $30,650.72 | 1.83% | $562.28 |
| 42.00% | $32,007.00 | $31,647.09 | 1.14% | $359.91 |
| 43.00% | $33,010.00 | $32,667.97 | 1.05% | $342.03 |
| 44.00% | $34,300.00 | $33,187.59 | 3.35% | $1,112.41 |
| 45.00% | $35,000.00 | $34,709.72 | 0.84% | $290.28 |
| 46.00% | $35,030.00 | $35,730.59 | -1.96% | -$700.59 |
| 47.00% | $36,000.00 | $35,732.63 | 0.75% | $267.37 |
| 48.00% | $37,002.00 | $36,310.45 | 1.90% | $691.55 |
| 49.00% | $38,002.00 | $37,067.93 | 2.52% | $934.07 |
| 50.00% | $39,048.00 | $38,395.07 | 1.70% | $652.93 |
| 51.00% | $40,000.00 | $39,228.10 | 1.97% | $771.90 |
| 52.00% | $40,010.00 | $40,834.96 | -2.02% | -$824.96 |
| 53.00% | $40,600.00 | $40,835.98 | -0.58% | -$235.98 |
| 54.00% | $42,000.00 | $40,988.09 | 2.47% | $1,011.91 |
| 55.00% | $43,000.00 | $42,374.44 | 1.48% | $625.56 |
| 56.00% | $44,500.00 | $43,112.53 | 3.22% | $1,387.47 |
| 57.00% | $45,003.00 | $44,591.78 | 0.92% | $411.22 |
| 58.00% | $45,793.00 | $45,939.33 | -0.32% | -$146.33 |
| 59.00% | $47,058.00 | $46,015.90 | 2.26% | $1,042.10 |
| 60.00% | $48,335.00 | $47,088.83 | 2.65% | $1,246.17 |
| 61.00% | $50,000.00 | $48,983.58 | 2.08% | $1,016.42 |
| 62.00% | $50,008.00 | $50,037.12 | -0.06% | -$29.12 |
| 63.00% | $50,600.00 | $51,043.70 | -0.87% | -$443.70 |
| 64.00% | $52,001.00 | $51,073.31 | 1.82% | $927.69 |
| 65.00% | $53,440.00 | $52,077.85 | 2.62% | $1,362.15 |
| 66.00% | $55,001.00 | $53,214.08 | 3.36% | $1,786.92 |
| 67.00% | $56,000.00 | $55,150.68 | 1.54% | $849.32 |
| 68.00% | $58,000.00 | $56,167.47 | 3.26% | $1,832.53 |
| 69.00% | $60,000.00 | $57,341.47 | 4.64% | $2,658.53 |
| 70.00% | $60,020.00 | $59,437.33 | 0.98% | $582.67 |
| 71.00% | $61,150.00 | $61,252.44 | -0.17% | -$102.44 |
| 72.00% | $63,131.00 | $61,361.67 | 2.88% | $1,769.33 |
| 73.00% | $65,006.00 | $63,297.25 | 2.70% | $1,708.75 |
| 74.00% | $66,529.00 | $65,765.72 | 1.16% | $763.28 |
| 75.00% | $69,007.00 | $66,601.82 | 3.61% | $2,405.18 |
| 76.00% | $70,040.00 | $69,409.22 | 0.91% | $630.78 |
| 77.00% | $72,046.00 | $71,461.18 | 0.82% | $584.82 |
| 78.00% | $75,000.00 | $72,485.12 | 3.47% | $2,514.88 |
| 79.00% | $76,005.00 | $75,400.73 | 0.80% | $604.27 |
| 80.00% | $79,050.00 | $76,633.95 | 3.15% | $2,416.05 |
| 81.00% | $80,130.00 | $79,475.04 | 0.82% | $654.96 |
| 82.00% | $83,000.00 | $81,680.13 | 1.62% | $1,319.87 |
| 83.00% | $85,530.00 | $83,728.00 | 2.15% | $1,802.00 |
| 84.00% | $89,550.00 | $86,831.46 | 3.13% | $2,718.54 |
| 85.00% | $92,000.00 | $91,294.72 | 0.77% | $705.28 |
| 86.00% | $96,225.00 | $93,912.24 | 2.46% | $2,312.76 |
| 87.00% | $100,003.00 | $98,003.90 | 2.04% | $1,999.10 |
| 88.00% | $102,035.00 | $102,089.44 | -0.05% | -$54.44 |
| 89.00% | $108,023.00 | $104,143.44 | 3.73% | $3,879.56 |
| 90.00% | $114,068.00 | $110,288.08 | 3.43% | $3,779.92 |
| 91.00% | $120,040.00 | $116,501.12 | 3.04% | $3,538.88 |
| 92.00% | $126,101.00 | $123,017.36 | 2.51% | $3,083.64 |
| 93.00% | $135,096.00 | $131,741.75 | 2.55% | $3,354.25 |
| 94.00% | $145,443.00 | $142,923.38 | 1.76% | $2,519.62 |
| 95.00% | $153,420.00 | $153,437.36 | -0.01% | -$17.36 |
| 96.00% | $170,240.00 | $168,444.21 | 1.07% | $1,795.79 |
| 97.00% | $195,100.00 | $191,130.07 | 2.08% | $3,969.93 |
| 98.00% | $225,786.00 | $224,591.26 | 0.53% | $1,194.74 |
| 99.00% | $300,577.00 | $307,078.90 | -2.12% | -$6,501.90 |
Full-year 2016 amounts quoted are net of CPI adjustment as seen here.
Methodology for the 2018 United States Individual Income Brackets
Data originated in the United States Census Bureau's Annual ASEC survey released in September 2018. The University of Minnesota's Minnesota Population Center harmonizes it and simplifies extraction.
Sarah Flood, Miriam King, Renae Rodgers, Steven Ruggles, and J. Robert Warren. Integrated Public Use Microdata Series, Current Population Survey: Version 6.0 [dataset]. Minneapolis, MN: IPUMS, 2018. https://doi.org/10.18128/D030.V6.0
Due to aggressive complaints in past years we have a very inclusive screen for determining workforce. It includes people who work some as well as people who want to work:
- 'Maybe' or 'Yes' want to work OR
- Worked 1 or more hour a week in 2017 OR
- Otherwise worked last year (WORKLY)
As for data quality, this leaves plenty of points for 2017 data:
- 93,820 data-points representing an estimated 173,874,158 American workers.
Conclusions on United States Individual Income Brackets for 2018
While it was slightly 'easier' by dollar amount to be a one percenter in 2018, it was the second year row it has taken north of $300,000. Even unadjusted for inflation, being a top 1% individual income earner was $699.19 easier in 2017 than 2016. Further, 13.4% of workers made a six-figure income in 2017. (That's up from 12.2% in 2016.)
Admittedly, we had assumed that the first full year of data under President Trump would show greater gains in the top ends of the individual income ranges. Perhaps of note, one hypothesis: the TCJA (also known as the Trump Tax Plan) takes effect in 2018 and some 2017 income may have been deferred.
While some medianish incomes (between 20th - 80th percentiles) saw inflation adjusted declines, most brackets saw increases from 2016 to 2017. We can't draw conclusions about individuals, of course - some folks may have made large jumps between percentiles. However, broad inflation gains can only come from across the board improvements... assuming low income earners didn't drop out in droves.
(We should carefully note: there isn't evidence of dropouts in the data.)
All in all, another good print on the income front. We've only been doing this type of work since 2012, but there's been a lot of good news in the last 6 years. Let's keep it coming.
Did you make more income in 2017 or 2016? How much was from your day job? Your business? How about investments?
