
In this post you'll find household income by state and individual income by state statistics for the United States in 2020 (using the newest data we have through mid-2021). Also on the page is average income by state for households or individual workers, plus the median income and top 1% income for the same divisions. Finally, if you are interested in only wage income or salary, you'll find the breakdowns near the end of the post.
Income is pre-tax (gross) income earned between January and December 2019.
We also have aggregated research on household income and individual income.
Household Income by State in 2020
As the most important measure of income, household income leads our income by state roundup.
Total earnings in a household best determines a household's standard of living, as people in a household can pool earnings. Even though individual income can be useful to compare – or are even more fun to compare – household income is the more important measure.
You can find more on household income percentiles here.
Average Household Income by State
Average household income is a common benchmark, but please note that it is skewed by high earning households. In the United States, the average household income was $97,973.61 in 2020.
(That would be the 65th household income percentile on its own.)
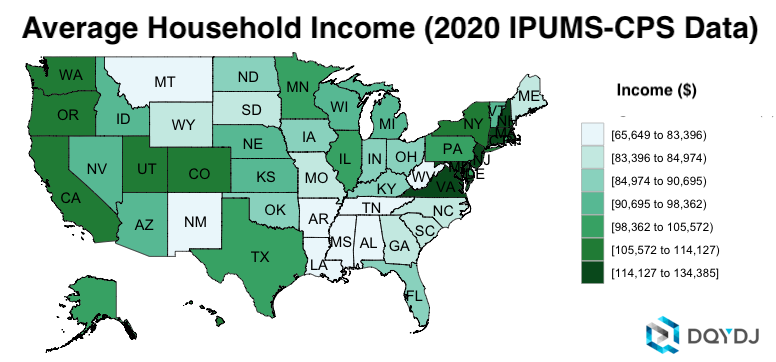
Here was the average household income per state (and Washington, D.C.) in 2020:
| State | Average Income |
| Alabama | $78,871.29 |
| Alaska | $100,086.45 |
| Arizona | $96,364.72 |
| Arkansas | $77,637.36 |
| California | $111,632.93 |
| Colorado | $107,936.13 |
| Connecticut | $117,303.22 |
| Delaware | $102,639.68 |
| District of Columbia | $134,385.32 |
| Florida | $85,581.31 |
| Georgia | $84,224.69 |
| Hawaii | $105,978.87 |
| Idaho | $91,721.86 |
| Illinois | $103,958.50 |
| Indiana | $87,139.09 |
| Iowa | $86,536.71 |
| Kansas | $96,719.61 |
| Kentucky | $87,474.11 |
| Louisiana | $78,124.94 |
| Maine | $84,312.62 |
| Maryland | $125,053.40 |
| Massachusetts | $127,460.73 |
| Michigan | $92,073.46 |
| Minnesota | $104,195.36 |
| Mississippi | $65,648.61 |
| Missouri | $83,396.09 |
| Montana | $81,638.21 |
| Nebraska | $93,878.49 |
| Nevada | $92,457.31 |
| New Hampshire | $114,680.66 |
| New Jersey | $119,305.58 |
| New Mexico | $71,531.93 |
| New York | $105,571.94 |
| North Carolina | $84,727.74 |
| North Dakota | $90,647.13 |
| Ohio | $90,396.68 |
| Oklahoma | $84,974.15 |
| Oregon | $107,795.68 |
| Pennsylvania | $99,681.52 |
| Rhode Island | $98,980.03 |
| South Carolina | $83,649.63 |
| South Dakota | $83,574.96 |
| Tennessee | $81,911.63 |
| Texas | $98,362.04 |
| Utah | $112,799.70 |
| Vermont | $95,683.34 |
| Virginia | $114,127.44 |
| Washington | $110,680.46 |
| West Virginia | $72,857.68 |
| Wisconsin | $90,695.26 |
| Wyoming | $84,500.23 |
Median Household Income by State
In most ways, median household income is the superior statistic when evaluating how American households are doing. Median household income means that half of all households earn more and half earn less.
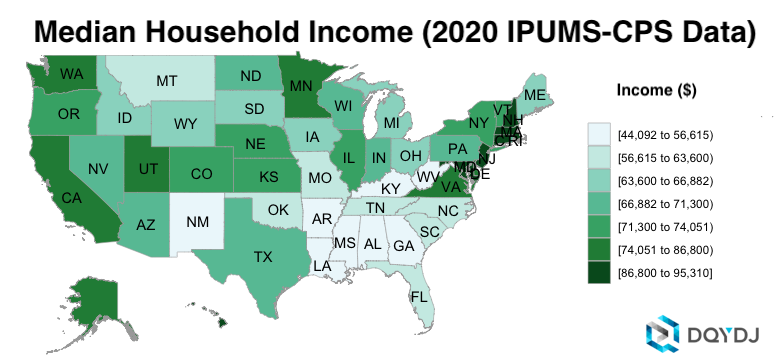
Across the entire United States, the median household income was $68,400.00 in 2020. Here is the median household income by state (And Washington, D.C.):
| State | Median Household Income |
| Alabama | $55,935.00 |
| Alaska | $78,038.00 |
| Arizona | $70,080.00 |
| Arkansas | $54,322.00 |
| California | $78,002.00 |
| Colorado | $72,400.00 |
| Connecticut | $87,005.00 |
| Delaware | $74,051.00 |
| District of Columbia | $93,000.00 |
| Florida | $58,150.00 |
| Georgia | $56,480.00 |
| Hawaii | $88,101.00 |
| Idaho | $65,326.00 |
| Illinois | $74,030.00 |
| Indiana | $66,882.00 |
| Iowa | $65,635.00 |
| Kansas | $73,110.00 |
| Kentucky | $55,520.00 |
| Louisiana | $51,760.00 |
| Maine | $65,800.00 |
| Maryland | $95,310.00 |
| Massachusetts | $87,264.00 |
| Michigan | $63,769.00 |
| Minnesota | $81,260.00 |
| Mississippi | $44,092.00 |
| Missouri | $60,010.00 |
| Montana | $60,000.00 |
| Nebraska | $73,000.00 |
| Nevada | $70,627.00 |
| New Hampshire | $86,800.00 |
| New Jersey | $87,352.00 |
| New Mexico | $53,021.00 |
| New York | $71,300.00 |
| North Carolina | $60,300.00 |
| North Dakota | $70,000.00 |
| Ohio | $64,782.00 |
| Oklahoma | $59,303.00 |
| Oregon | $73,900.00 |
| Pennsylvania | $69,913.00 |
| Rhode Island | $70,002.00 |
| South Carolina | $61,476.00 |
| South Dakota | $63,600.00 |
| Tennessee | $56,615.00 |
| Texas | $67,280.00 |
| Utah | $84,517.00 |
| Vermont | $73,800.00 |
| Virginia | $81,000.00 |
| Washington | $82,175.00 |
| West Virginia | $53,520.00 |
| Wisconsin | $67,163.00 |
| Wyoming | $64,587.00 |
Top 1% Household Income by State
The top 1% household income is a popular measure for affluence. Countrywide, the threshold for the top 1% was $531,020.00 in 2020.
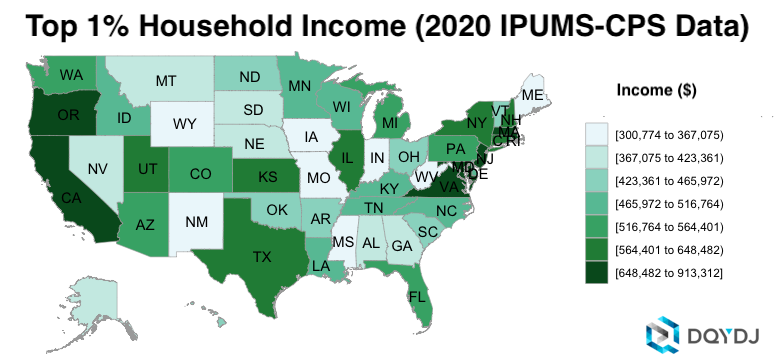
Here is the top 1% household income by state:
| State | Top 1% Household Income |
| Alabama | $375,020.00 |
| Alaska | $403,841.00 |
| Arizona | $525,150.00 |
| Arkansas | $449,066.00 |
| California | $648,482.00 |
| Colorado | $562,500.00 |
| Connecticut | $587,377.00 |
| Delaware | $465,972.00 |
| District of Columbia | $913,312.00 |
| Florida | $545,548.00 |
| Georgia | $380,137.00 |
| Hawaii | $443,192.00 |
| Idaho | $489,981.00 |
| Illinois | $583,957.00 |
| Indiana | $360,012.00 |
| Iowa | $362,576.00 |
| Kansas | $564,401.00 |
| Kentucky | $516,469.00 |
| Louisiana | $484,033.00 |
| Maine | $329,232.00 |
| Maryland | $659,690.00 |
| Massachusetts | $677,400.00 |
| Michigan | $519,812.00 |
| Minnesota | $481,681.00 |
| Mississippi | $333,715.00 |
| Missouri | $351,225.00 |
| Montana | $395,350.00 |
| Nebraska | $397,620.00 |
| Nevada | $406,124.00 |
| New Hampshire | $596,154.00 |
| New Jersey | $663,508.00 |
| New Mexico | $300,774.00 |
| New York | $621,321.00 |
| North Carolina | $509,000.00 |
| North Dakota | $464,000.00 |
| Ohio | $444,024.00 |
| Oklahoma | $423,361.00 |
| Oregon | $651,531.00 |
| Pennsylvania | $552,899.00 |
| Rhode Island | $529,030.00 |
| South Carolina | $436,200.00 |
| South Dakota | $367,075.00 |
| Tennessee | $470,002.00 |
| Texas | $565,719.00 |
| Utah | $597,450.00 |
| Vermont | $438,421.00 |
| Virginia | $698,202.00 |
| Washington | $516,764.00 |
| West Virginia | $330,660.00 |
| Wisconsin | $466,384.00 |
| Wyoming | $343,100.00 |
Note that near the top, the income distribution isn't as "well behaved". There are larger gaps between percentiles, so you should take the top 1% with a grain of salt.
In the next section, I'll list how many samples there were in a state (and how they map to households) so you can use your expertise to think about how close the "actual" number may be.
Household Income by State Methodology
I make my income calculations on microdata from the United States Census Bureau’s Annual ASEC survey. Specifically, I use the harmonized data from the University of Minnesota. You can find more details in the average household income post.
Sarah Flood, Miriam King, Renae Rodgers, Steven Ruggles and J. Robert Warren. Integrated Public Use Microdata Series, Current Population Survey: Version 8.0 [dataset]. Minneapolis, MN: IPUMS, 2020.
https://doi.org/10.18128/D030.V8.0
Household Income Data Quality and Households Per State
This next table shows the number of households in the survey per state, plus the number of households implied by those weighting for 2020.
| State | Estimated Households | Samples |
| Alabama | 1,983,435 | 1,295 |
| Alaska | 259,186 | 714 |
| Arizona | 2,806,872 | 1,023 |
| Arkansas | 1,232,952 | 1,101 |
| California | 14,096,269 | 5,529 |
| Colorado | 2,357,674 | 734 |
| Connecticut | 1,396,528 | 603 |
| Delaware | 372,561 | 612 |
| District of Columbia | 330,846 | 1,118 |
| Florida | 8,893,205 | 2,894 |
| Georgia | 4,076,706 | 1,360 |
| Hawaii | 476,068 | 856 |
| Idaho | 708,416 | 969 |
| Illinois | 5,046,457 | 1,580 |
| Indiana | 2,699,134 | 977 |
| Iowa | 1,304,614 | 716 |
| Kansas | 1,084,330 | 744 |
| Kentucky | 1,824,191 | 670 |
| Louisiana | 1,878,521 | 1,484 |
| Maine | 575,323 | 468 |
| Maryland | 2,362,736 | 735 |
| Massachusetts | 2,737,789 | 1,247 |
| Michigan | 4,199,842 | 1,412 |
| Minnesota | 2,344,371 | 801 |
| Mississippi | 1,163,990 | 1,132 |
| Missouri | 2,556,957 | 822 |
| Montana | 465,785 | 1,067 |
| Nebraska | 745,658 | 777 |
| Nevada | 1,234,453 | 888 |
| New Hampshire | 543,606 | 749 |
| New Jersey | 3,270,333 | 1,090 |
| New Mexico | 843,940 | 1,186 |
| New York | 7,610,431 | 2,462 |
| North Carolina | 4,355,297 | 1,418 |
| North Dakota | 324,435 | 901 |
| Ohio | 4,721,969 | 1,401 |
| Oklahoma | 1,585,699 | 932 |
| Oregon | 1,680,749 | 951 |
| Pennsylvania | 5,214,314 | 1,569 |
| Rhode Island | 451,237 | 524 |
| South Carolina | 2,160,213 | 1,015 |
| South Dakota | 357,940 | 692 |
| Tennessee | 2,788,863 | 1,112 |
| Texas | 10,410,298 | 3,397 |
| Utah | 1,063,381 | 881 |
| Vermont | 275,455 | 752 |
| Virginia | 3,345,835 | 1,133 |
| Washington | 2,975,901 | 1,154 |
| West Virginia | 744,149 | 1,111 |
| Wisconsin | 2,410,999 | 864 |
| Wyoming | 238,289 | 838 |
Individual Income by State in 2020
As I wrote above, household income is a better measure of spending power than individual income. However, often individual income is what you need to check – and it is often more interesting.
These stats below try to filter out people not in the workforce. The remaining set is people who worked in 2019 – or even wanted to work. You can find more information on individual income statistics here, and it also goes into details on the full screen.
Average Individual Income by State
The average individual income in America in 2019 was $62,518.13. Remember: this number is skewed by high earners; be sure to check out median income below for a better measure of most people.
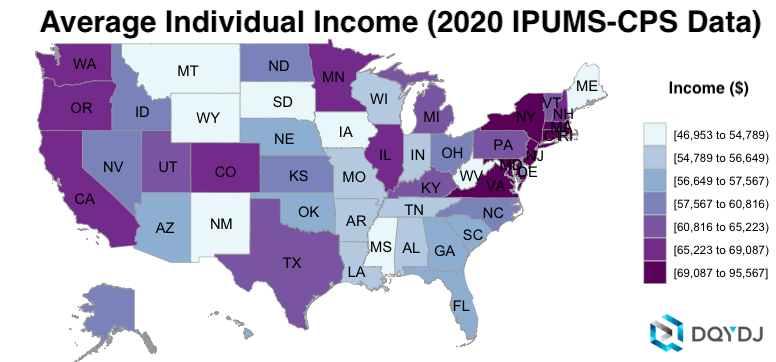
Here's the average individual income by state (and D.C.):
| State | Average Income |
| Alabama | $54,813.68 |
| Alaska | $58,920.08 |
| Arizona | $57,407.70 |
| Arkansas | $55,897.80 |
| California | $66,461.85 |
| Colorado | $67,241.75 |
| Connecticut | $72,776.72 |
| Delaware | $59,517.97 |
| District of Columbia | $95,567.30 |
| Florida | $57,369.16 |
| Georgia | $56,713.19 |
| Hawaii | $57,290.63 |
| Idaho | $57,954.26 |
| Illinois | $66,554.70 |
| Indiana | $55,290.18 |
| Iowa | $51,783.06 |
| Kansas | $58,572.18 |
| Kentucky | $61,705.77 |
| Louisiana | $56,446.95 |
| Maine | $54,000.26 |
| Maryland | $73,647.05 |
| Massachusetts | $77,199.91 |
| Michigan | $61,395.79 |
| Minnesota | $65,222.83 |
| Mississippi | $46,953.35 |
| Missouri | $54,788.51 |
| Montana | $53,281.59 |
| Nebraska | $56,649.33 |
| Nevada | $58,938.59 |
| New Hampshire | $66,598.99 |
| New Jersey | $73,159.13 |
| New Mexico | $48,371.89 |
| New York | $69,086.59 |
| North Carolina | $57,566.96 |
| North Dakota | $58,875.96 |
| Ohio | $58,753.66 |
| Oklahoma | $57,103.57 |
| Oregon | $66,693.35 |
| Pennsylvania | $62,966.43 |
| Rhode Island | $65,078.69 |
| South Carolina | $57,521.78 |
| South Dakota | $52,521.75 |
| Tennessee | $55,108.40 |
| Texas | $60,816.03 |
| Utah | $60,920.73 |
| Vermont | $61,746.07 |
| Virginia | $72,435.83 |
| Washington | $68,176.56 |
| West Virginia | $50,365.76 |
| Wisconsin | $56,561.38 |
| Wyoming | $51,739.80 |
Median Individual Income by State
Again, median individual incomes are a better measure for most purposes. They denote where half of workers make more – and half make less. In 2020, the overall median individual income was $43,206.00.
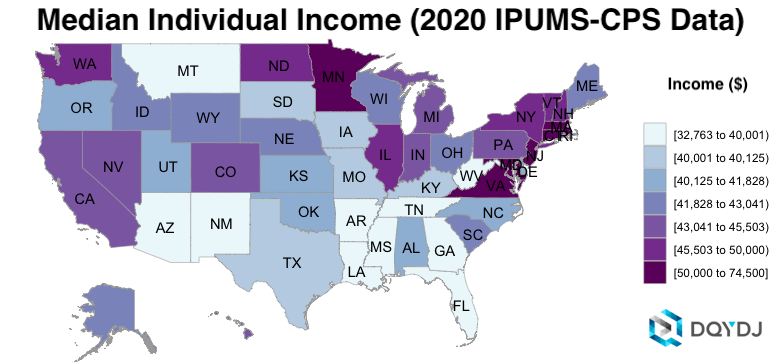
Here's the median individual income by state (plus D.C.):
| State | Median Individual Income |
| Alabama | $41,000.00 |
| Alaska | $42,606.00 |
| Arizona | $39,501.00 |
| Arkansas | $40,000.00 |
| California | $44,410.00 |
| Colorado | $45,030.00 |
| Connecticut | $50,015.00 |
| Delaware | $40,402.00 |
| District of Columbia | $74,500.00 |
| Florida | $40,000.00 |
| Georgia | $39,524.00 |
| Hawaii | $45,055.00 |
| Idaho | $42,102.00 |
| Illinois | $46,481.00 |
| Indiana | $43,041.00 |
| Iowa | $40,020.00 |
| Kansas | $41,080.00 |
| Kentucky | $40,026.00 |
| Louisiana | $40,000.00 |
| Maine | $42,551.00 |
| Maryland | $52,000.00 |
| Massachusetts | $53,017.00 |
| Michigan | $44,606.00 |
| Minnesota | $50,000.00 |
| Mississippi | $32,763.00 |
| Missouri | $40,050.00 |
| Montana | $39,000.00 |
| Nebraska | $43,010.00 |
| Nevada | $43,900.00 |
| New Hampshire | $48,226.00 |
| New Jersey | $51,510.00 |
| New Mexico | $36,000.00 |
| New York | $46,020.00 |
| North Carolina | $40,125.00 |
| North Dakota | $45,503.00 |
| Ohio | $41,828.00 |
| Oklahoma | $40,400.00 |
| Oregon | $41,602.00 |
| Pennsylvania | $44,220.00 |
| Rhode Island | $48,000.00 |
| South Carolina | $42,000.00 |
| South Dakota | $40,001.00 |
| Tennessee | $40,000.00 |
| Texas | $40,075.00 |
| Utah | $40,606.00 |
| Vermont | $47,000.00 |
| Virginia | $50,010.00 |
| Washington | $48,137.00 |
| West Virginia | $38,000.00 |
| Wisconsin | $43,020.00 |
| Wyoming | $42,100.00 |
Top 1% Individual Income by State
And of course, because it comes up so often, we also need the top 1% individual incomes by state!
As with the household income, be more skeptical of these numbers – there just aren't as many earners, and earnings are more spread out than the rest of the distribution (still, they should be close).

In 2020, the top 1% individual income countrywide was $361,020.00. Here are the top 1% individual incomes by state:
| State | Top 1% Individual Income |
| Alabama | $264,010.00 |
| Alaska | $299,250.00 |
| Arizona | $333,250.00 |
| Arkansas | $350,050.00 |
| California | $402,014.00 |
| Colorado | $407,626.00 |
| Connecticut | $426,006.00 |
| Delaware | $276,442.00 |
| District of Columbia | $516,875.00 |
| Florida | $369,025.00 |
| Georgia | $285,350.00 |
| Hawaii | $282,927.00 |
| Idaho | $363,088.00 |
| Illinois | $422,305.00 |
| Indiana | $245,600.00 |
| Iowa | $235,020.00 |
| Kansas | $359,015.00 |
| Kentucky | $401,000.00 |
| Louisiana | $363,000.00 |
| Maine | $246,251.00 |
| Maryland | $500,074.00 |
| Massachusetts | $472,070.00 |
| Michigan | $333,300.00 |
| Minnesota | $348,510.00 |
| Mississippi | $240,106.00 |
| Missouri | $253,300.00 |
| Montana | $320,010.00 |
| Nebraska | $261,011.00 |
| Nevada | $300,003.00 |
| New Hampshire | $370,000.00 |
| New Jersey | $400,234.00 |
| New Mexico | $227,000.00 |
| New York | $420,119.00 |
| North Carolina | $392,000.00 |
| North Dakota | $330,162.00 |
| Ohio | $354,725.00 |
| Oklahoma | $305,250.00 |
| Oregon | $501,750.00 |
| Pennsylvania | $343,045.00 |
| Rhode Island | $321,139.00 |
| South Carolina | $310,630.00 |
| South Dakota | $270,113.00 |
| Tennessee | $300,100.00 |
| Texas | $379,000.00 |
| Utah | $416,400.00 |
| Vermont | $312,350.00 |
| Virginia | $443,175.00 |
| Washington | $363,002.00 |
| West Virginia | $251,862.00 |
| Wisconsin | $298,667.00 |
| Wyoming | $210,001.00 |
Individual Income by State Methodology and Estimated Households
Again, for individual income I use microdata from the ASEC survey harmonized by the University of Minnesota.
Sarah Flood, Miriam King, Renae Rodgers, Steven Ruggles and J. Robert Warren. Integrated Public Use Microdata Series, Current Population Survey: Version 8.0 [dataset]. Minneapolis, MN: IPUMS, 2020.
https://doi.org/10.18128/D030.V8.0
The art here is identifying "workers". Since this is data over an entire year, our workers measure will never match, for example, some individual month's employment survey. It's "people who were part of the workforce in 2019, or wanted to be part."
For more on the screen, see our average individual income article.
Individual Income by State Data Quality and Estimated Workforce
In this next table, I list the number of survey samples per state, as well as the number of workers those samples are weighted into. You can use this to decide how much you trust the numbers above (especially the top 1%).
| State | Estimated Workers | Samples |
| Alabama | 2,345,501 | 1,515 |
| Alaska | 387,118 | 1,072 |
| Arizona | 3,895,162 | 1,446 |
| Arkansas | 1,449,640 | 1,310 |
| California | 20,998,498 | 8,250 |
| Colorado | 3,316,264 | 1,029 |
| Connecticut | 1,977,584 | 859 |
| Delaware | 515,309 | 849 |
| District of Columbia | 442,523 | 1,404 |
| Florida | 11,035,962 | 3,607 |
| Georgia | 5,402,642 | 1,774 |
| Hawaii | 742,767 | 1,312 |
| Idaho | 966,441 | 1,384 |
| Illinois | 6,932,214 | 2,229 |
| Indiana | 3,667,386 | 1,364 |
| Iowa | 1,834,463 | 1,060 |
| Kansas | 1,603,672 | 1,100 |
| Kentucky | 2,201,401 | 814 |
| Louisiana | 2,296,080 | 1,804 |
| Maine | 767,767 | 621 |
| Maryland | 3,637,703 | 1,126 |
| Massachusetts | 4,062,667 | 1,905 |
| Michigan | 5,356,761 | 1,829 |
| Minnesota | 3,278,203 | 1,198 |
| Mississippi | 1,391,732 | 1,306 |
| Missouri | 3,341,424 | 1,096 |
| Montana | 587,057 | 1,406 |
| Nebraska | 1,114,824 | 1,185 |
| Nevada | 1,685,502 | 1,228 |
| New Hampshire | 817,376 | 1,116 |
| New Jersey | 4,804,605 | 1,550 |
| New Mexico | 1,006,239 | 1,386 |
| New York | 10,356,691 | 3,351 |
| North Carolina | 5,510,434 | 1,808 |
| North Dakota | 436,980 | 1,248 |
| Ohio | 6,239,145 | 1,863 |
| Oklahoma | 2,045,073 | 1,238 |
| Oregon | 2,263,218 | 1,366 |
| Pennsylvania | 7,139,041 | 2,178 |
| Rhode Island | 603,650 | 698 |
| South Carolina | 2,672,505 | 1,240 |
| South Dakota | 503,679 | 995 |
| Tennessee | 3,569,882 | 1,455 |
| Texas | 15,317,038 | 4,894 |
| Utah | 1,759,330 | 1,480 |
| Vermont | 371,942 | 1,020 |
| Virginia | 4,754,315 | 1,643 |
| Washington | 4,311,778 | 1,719 |
| West Virginia | 861,428 | 1,308 |
| Wisconsin | 3,322,455 | 1,231 |
| Wyoming | 313,237 | 1,121 |
Salary by State in 2020
Salary is an interesting subset of income. While income includes many sources – business income, interest, investment gains, rent, and so on – salary is only wage income earned at a job
You can find salary by age or aggregated salary statistics on DQYDJ also, but these sections will cover salary breakdowns per state.
Median Salary by State
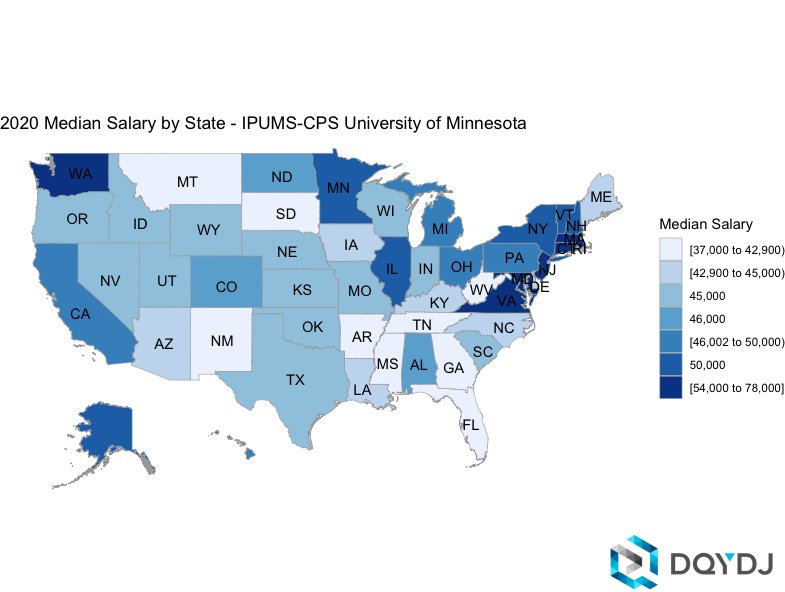
Here you'll find the median salary per state for the United States in 2020. It's the best measure of income – half of people made more wage income, and half made less in full year 2019.
You can read it as "the median worker was paid __ in wages in the state of ___".
| State | Median Salary |
| Alabama | $46,000.00 |
| Alaska | $50,000.00 |
| Arizona | $43,000.00 |
| Arkansas | $42,000.00 |
| California | $48,200.00 |
| Colorado | $46,000.00 |
| Connecticut | $55,000.00 |
| Delaware | $44,000.00 |
| District of Columbia | $78,000.00 |
| Florida | $40,000.00 |
| Georgia | $42,000.00 |
| Hawaii | $48,000.00 |
| Idaho | $45,000.00 |
| Illinois | $50,000.00 |
| Indiana | $45,000.00 |
| Iowa | $43,000.00 |
| Kansas | $45,000.00 |
| Kentucky | $44,000.00 |
| Louisiana | $43,000.00 |
| Maine | $43,000.00 |
| Maryland | $55,000.00 |
| Massachusetts | $57,000.00 |
| Michigan | $48,000.00 |
| Minnesota | $50,000.00 |
| Mississippi | $37,000.00 |
| Missouri | $45,000.00 |
| Montana | $40,000.00 |
| Nebraska | $45,000.00 |
| Nevada | $45,000.00 |
| New Hampshire | $50,000.00 |
| New Jersey | $56,000.00 |
| New Mexico | $38,480.00 |
| New York | $50,000.00 |
| North Carolina | $42,900.00 |
| North Dakota | $46,000.00 |
| Ohio | $46,002.00 |
| Oklahoma | $45,000.00 |
| Oregon | $45,000.00 |
| Pennsylvania | $49,088.00 |
| Rhode Island | $50,000.00 |
| South Carolina | $45,000.00 |
| South Dakota | $40,000.00 |
| Tennessee | $42,000.00 |
| Texas | $45,000.00 |
| Utah | $45,000.00 |
| Vermont | $50,000.00 |
| Virginia | $54,000.00 |
| Washington | $54,000.00 |
| West Virginia | $39,185.00 |
| Wisconsin | $45,000.00 |
| Wyoming | $45,000.00 |
Average Salary by State
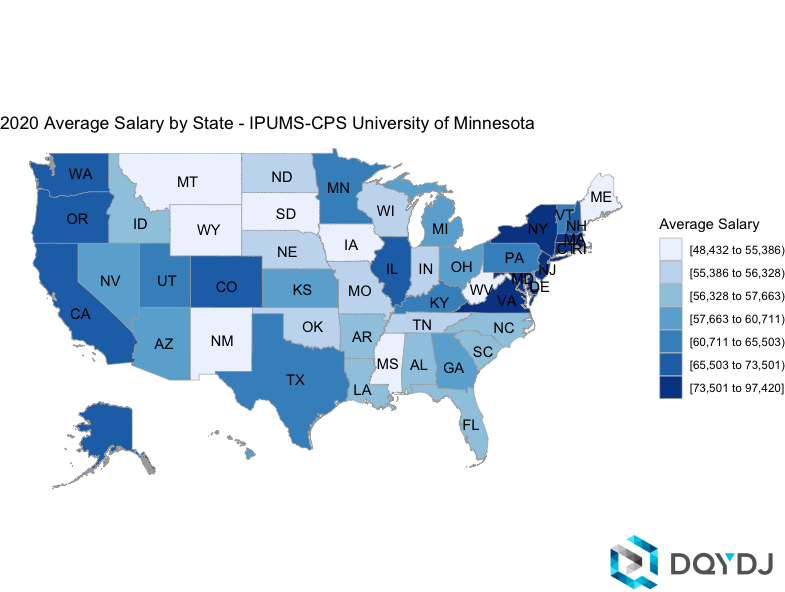
Below you'll find the average salary per state in the United States in 2020. It's probably the most search statistic – although as I note, the median salary is more descriptive.
Average salary is biased upwards by the large salaries near the top – if that's suitable for you, you'll find those averages here.
| State | Average Salary |
| Alabama | $56,791.64 |
| Alaska | $65,503.20 |
| Arizona | $57,662.70 |
| Arkansas | $56,965.86 |
| California | $68,309.59 |
| Colorado | $65,620.91 |
| Connecticut | $75,279.80 |
| Delaware | $59,895.01 |
| District of Columbia | $97,419.68 |
| Florida | $56,328.46 |
| Georgia | $58,732.75 |
| Hawaii | $57,865.53 |
| Idaho | $56,995.80 |
| Illinois | $68,217.03 |
| Indiana | $55,735.90 |
| Iowa | $49,922.69 |
| Kansas | $58,202.01 |
| Kentucky | $61,218.62 |
| Louisiana | $57,422.79 |
| Maine | $53,706.24 |
| Maryland | $73,501.40 |
| Massachusetts | $76,255.72 |
| Michigan | $60,379.17 |
| Minnesota | $63,624.18 |
| Mississippi | $49,604.43 |
| Missouri | $55,488.70 |
| Montana | $49,353.06 |
| Nebraska | $56,244.44 |
| Nevada | $59,626.00 |
| New Hampshire | $65,529.78 |
| New Jersey | $74,879.24 |
| New Mexico | $48,432.05 |
| New York | $73,707.18 |
| North Carolina | $56,463.06 |
| North Dakota | $55,613.41 |
| Ohio | $59,767.39 |
| Oklahoma | $55,385.91 |
| Oregon | $67,296.92 |
| Pennsylvania | $64,232.74 |
| Rhode Island | $63,963.35 |
| South Carolina | $57,187.49 |
| South Dakota | $51,008.89 |
| Tennessee | $55,895.16 |
| Texas | $62,584.33 |
| Utah | $60,711.03 |
| Vermont | $61,002.70 |
| Virginia | $74,231.34 |
| Washington | $70,534.09 |
| West Virginia | $49,897.80 |
| Wisconsin | $56,247.78 |
| Wyoming | $51,154.77 |
Top 1% Salary by State
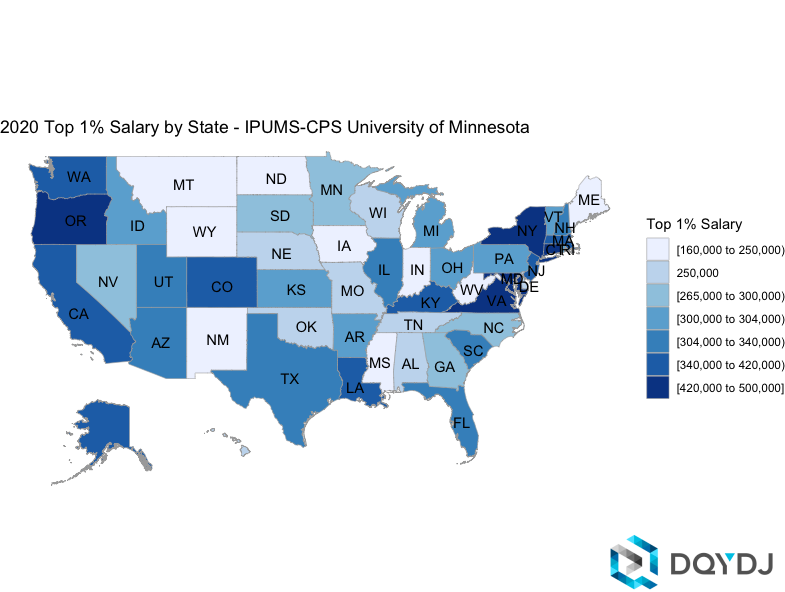
This next table shows the top 1% salary per state for the United States in 2020. As I caution elsewhere, be careful with the top few percentiles – by definition these folks are outliers.
While the estimates should be reasonably close to the actual 1% salary, beware it may vary by thousands of dollars. You can also judge accuracy by the data point count – you'll find that below.
| State | Top 1% Salary |
| Alabama | $250,000.00 |
| Alaska | $360,000.00 |
| Arizona | $325,000.00 |
| Arkansas | $300,000.00 |
| California | $400,000.00 |
| Colorado | $350,000.00 |
| Connecticut | $420,000.00 |
| Delaware | $250,000.00 |
| District of Columbia | $500,000.00 |
| Florida | $330,000.00 |
| Georgia | $280,000.00 |
| Hawaii | $250,000.00 |
| Idaho | $300,000.00 |
| Illinois | $315,000.00 |
| Indiana | $202,000.00 |
| Iowa | $180,000.00 |
| Kansas | $300,000.00 |
| Kentucky | $400,000.00 |
| Louisiana | $345,000.00 |
| Maine | $200,000.00 |
| Maryland | $460,000.00 |
| Massachusetts | $350,000.00 |
| Michigan | $300,000.00 |
| Minnesota | $299,282.00 |
| Mississippi | $220,000.00 |
| Missouri | $250,000.00 |
| Montana | $200,000.00 |
| Nebraska | $250,000.00 |
| Nevada | $265,000.00 |
| New Hampshire | $330,000.00 |
| New Jersey | $350,000.00 |
| New Mexico | $180,000.00 |
| New York | $460,000.00 |
| North Carolina | $280,000.00 |
| North Dakota | $230,000.00 |
| Ohio | $302,000.00 |
| Oklahoma | $250,000.00 |
| Oregon | $430,000.00 |
| Pennsylvania | $300,000.00 |
| Rhode Island | $300,000.00 |
| South Carolina | $325,000.00 |
| South Dakota | $290,000.00 |
| Tennessee | $250,000.00 |
| Texas | $325,000.00 |
| Utah | $304,000.00 |
| Vermont | $302,000.00 |
| Virginia | $450,000.00 |
| Washington | $340,000.00 |
| West Virginia | $230,000.00 |
| Wisconsin | $250,000.00 |
| Wyoming | $160,000.00 |
Salary by State Methodology
You can find the full screen in the salary research post. This post adds a filter to split the resulting folks into different states. As with the other two sets, this data is sourced from:
Sarah Flood, Miriam King, Renae Rodgers, Steven Ruggles and J. Robert Warren. Integrated Public Use Microdata Series, Current Population Survey: Version 8.0 [dataset]. Minneapolis, MN: IPUMS, 2020.
https://doi.org/10.18128/D030.V8.0
Salary by State Data Quality
This next table shows you how many people are remaining after the screen – both the data points, and the number of workers they map onto. You can use this to decide how much you trust the salary data from an individual state (especially the top few percent).
Diving Deep on State Incomes
This is a hard one to visualize – there is just so much data backing this post. But don't worry, there's a better way – check out our income percentile by state calculator. There you can compare states head to head for household income, individual income, and salary, and choose to show or hide states to see the info you need.
And income by state is a pretty good measure – especially for smaller states. However, it doesn't really show much in all cases.
For example, a good income in Humboldt County, California does not necessarily go as far in the San Francisco Bay Area. For this, I made an income percentile by city post – it's even better (well, if the metro you are interested in is listed!).
But let's be honest: state is a pretty good slice.
See past data:
