
In this post I estimate household income by state and individual income by state statistics for the United States in 2019. All your favorite summary income statistics are here: average income by state for households or individual workers, plus the median income and top 1% income for the same divisions.
Income is pre-tax (gross) income earned between January and December 2018, for comparison.
We also have aggregated research on household income and individual income.
Household Income by State
Household income – appropriately – leads our income by state roundup. Total earnings in a household best determine a household's potential standard of living, even if you usually only compare individual incomes. While individual income is interesting to benchmark, households with multiple earners can (and often do) make significantly more money than single earner households.
Let's kick it off with a look at average household income per state, then move on to median, and top 1% household earnings per state. You can find more on household income percentiles here.
Average Household Income by State
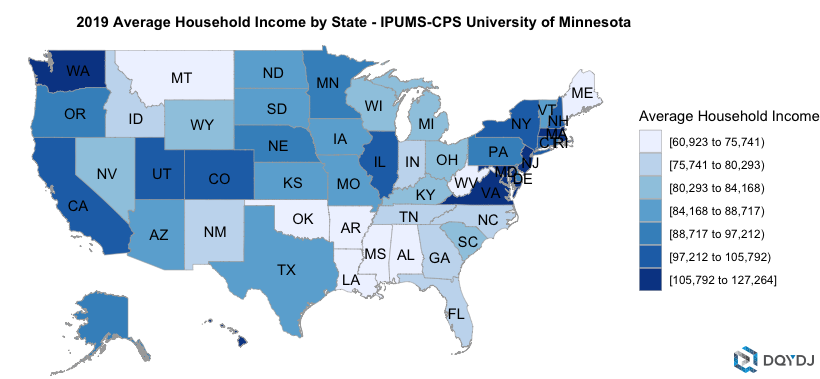
Average household income is a common benchmark to seek, but please note that it is skewed by high earning households. Countrywide, the average household income was $89,930.70 in 2019.
(On its own, that would be the 65th household income percentile.)
Enough caveats – the following table lists the average household income for every state and Washington, D.C. in 2019:
| State | Average Household Income |
| Alabama | $70,090.35 |
| Alaska | $91,268.57 |
| Arizona | $87,823.18 |
| Arkansas | $68,079.14 |
| California | $102,375.47 |
| Colorado | $98,129.07 |
| Connecticut | $103,865.55 |
| Delaware | $93,957.11 |
| District of Columbia | $127,263.58 |
| Florida | $78,433.46 |
| Georgia | $79,797.68 |
| Hawaii | $108,561.68 |
| Idaho | $77,877.59 |
| Illinois | $97,212.04 |
| Indiana | $78,056.95 |
| Iowa | $86,231.80 |
| Kansas | $84,168.27 |
| Kentucky | $80,547.15 |
| Louisiana | $71,388.37 |
| Maine | $74,331.65 |
| Maryland | $108,787.55 |
| Massachusetts | $117,996.28 |
| Michigan | $82,676.47 |
| Minnesota | $96,785.18 |
| Mississippi | $60,922.93 |
| Missouri | $86,397.22 |
| Montana | $74,351.71 |
| Nebraska | $89,613.73 |
| Nevada | $83,997.52 |
| New Hampshire | $101,016.39 |
| New Jersey | $114,160.42 |
| New Mexico | $75,956.72 |
| New York | $102,330.23 |
| North Carolina | $75,741.17 |
| North Dakota | $86,102.51 |
| Ohio | $82,985.94 |
| Oklahoma | $74,872.16 |
| Oregon | $91,458.36 |
| Pennsylvania | $88,716.82 |
| Rhode Island | $92,008.88 |
| South Carolina | $80,500.78 |
| South Dakota | $84,257.55 |
| Tennessee | $79,019.22 |
| Texas | $84,470.84 |
| Utah | $100,221.80 |
| Vermont | $84,281.16 |
| Virginia | $105,791.79 |
| Washington | $106,407.57 |
| West Virginia | $66,563.23 |
| Wisconsin | $80,671.17 |
| Wyoming | $80,293.39 |
Median Household Income by State
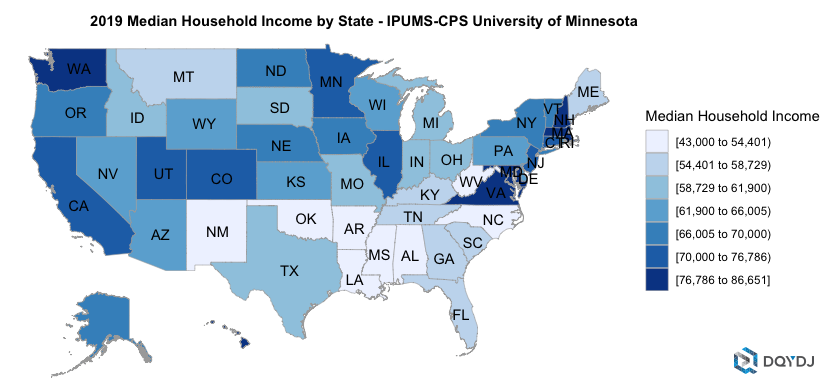
In many ways, median household income is a superior statistic when evaluating how American households are doing. Median household income means that half of all households earn more and half earn less, unlike the 65th percentile implied by average household income in 2019.
Across the entire United States, the median household income was $63,030.00 in 2019. That is $26,900.70 less than the average household income.
| State | Median Household Income |
| Alabama | $49,396.00 |
| Alaska | $68,400.00 |
| Arizona | $62,311.00 |
| Arkansas | $49,778.00 |
| California | $70,001.00 |
| Colorado | $72,620.00 |
| Connecticut | $73,011.00 |
| Delaware | $65,002.00 |
| District of Columbia | $85,101.00 |
| Florida | $54,401.00 |
| Georgia | $56,000.00 |
| Hawaii | $80,000.00 |
| Idaho | $58,729.00 |
| Illinois | $70,000.00 |
| Indiana | $59,690.00 |
| Iowa | $68,844.00 |
| Kansas | $63,726.00 |
| Kentucky | $54,616.00 |
| Louisiana | $49,665.00 |
| Maine | $58,001.00 |
| Maryland | $86,051.00 |
| Massachusetts | $86,651.00 |
| Michigan | $60,002.00 |
| Minnesota | $72,070.00 |
| Mississippi | $43,000.00 |
| Missouri | $61,110.00 |
| Montana | $58,000.00 |
| Nebraska | $67,653.00 |
| Nevada | $61,900.00 |
| New Hampshire | $81,000.00 |
| New Jersey | $74,100.00 |
| New Mexico | $48,000.00 |
| New York | $67,105.00 |
| North Carolina | $52,943.00 |
| North Dakota | $66,005.00 |
| Ohio | $61,398.00 |
| Oklahoma | $54,005.00 |
| Oregon | $69,358.00 |
| Pennsylvania | $64,305.00 |
| Rhode Island | $62,341.00 |
| South Carolina | $57,090.00 |
| South Dakota | $59,344.00 |
| Tennessee | $55,601.00 |
| Texas | $59,703.00 |
| Utah | $76,613.00 |
| Vermont | $69,844.00 |
| Virginia | $76,786.00 |
| Washington | $79,801.00 |
| West Virginia | $50,180.00 |
| Wisconsin | $62,676.00 |
| Wyoming | $62,002.00 |
Top 1% Household Income by State
The top 1% is where folks popularly draw the line for the very affluent. These households earn more than 99% of all households in the United States so have significant ongoing earnings power.
Note that income is a flow of money, not a stock – income and net worth are not as well correlated as you'd expect. However, if a household can sustain a top 1% income for a long time and save appropriately they can expect to accumulate a significant net worth.
(Look at these as relative numbers and guesses; there are fewer data points near the top.)
| State | Top 1% Household Income |
| Alabama | $335,281.00 |
| Alaska | $401,604.00 |
| Arizona | $415,000.00 |
| Arkansas | $350,148.00 |
| California | $597,981.00 |
| Colorado | $426,343.00 |
| Connecticut | $677,055.00 |
| Delaware | $548,500.00 |
| District of Columbia | $729,629.36 |
| Florida | $436,046.00 |
| Georgia | $447,840.00 |
| Hawaii | $619,273.00 |
| Idaho | $347,116.00 |
| Illinois | $517,539.00 |
| Indiana | $353,823.00 |
| Iowa | $348,863.00 |
| Kansas | $359,150.00 |
| Kentucky | $670,000.00 |
| Louisiana | $358,663.00 |
| Maine | $289,702.00 |
| Maryland | $467,555.00 |
| Massachusetts | $620,009.00 |
| Michigan | $394,736.00 |
| Minnesota | $503,037.00 |
| Mississippi | $320,757.00 |
| Missouri | $456,017.00 |
| Montana | $396,140.00 |
| Nebraska | $408,462.00 |
| Nevada | $453,012.00 |
| New Hampshire | $425,431.00 |
| New Jersey | $802,295.00 |
| New Mexico | $626,116.00 |
| New York | $586,106.00 |
| North Carolina | $410,813.00 |
| North Dakota | $501,730.00 |
| Ohio | $409,093.00 |
| Oklahoma | $359,416.00 |
| Oregon | $423,436.00 |
| Pennsylvania | $455,002.00 |
| Rhode Island | $452,510.00 |
| South Carolina | $400,000.00 |
| South Dakota | $431,411.00 |
| Tennessee | $448,625.00 |
| Texas | $440,010.00 |
| Utah | $543,592.00 |
| Vermont | $341,268.00 |
| Virginia | $491,625.00 |
| Washington | $542,269.00 |
| West Virginia | $320,722.00 |
| Wisconsin | $307,966.00 |
| Wyoming | $360,509.00 |
Household Income by State Methodology
Like all of our income data this year, I make my income calculations on microdata from the United States Census Bureau’s Annual ASEC survey. Specifically, I use the harmonized data from the University of Minnesota.
Sarah Flood, Miriam King, Renae Rodgers, Steven Ruggles and J. Robert Warren. Integrated Public Use Microdata Series, Current Population Survey: Version 6.0 [dataset]. Minneapolis, MN: IPUMS, 2019. https://doi.org/10.18128/D030.V6.0
Household Income Data Quality and Households Per State
As we slice this data more and more there is – of course – a reduction in resolution. Every state has enough data to give a reasonable approximation for income – but this isn't as good as surveying 100% of households (like in a decennial census).
This next table shows the number of households in the survey per state, plus the number of households implied by those weighting for 2019.
| State | Samples | Estimated Households |
| Alabama | 1,399 | 2,042,477 |
| Alaska | 783 | 270,796 |
| Arizona | 1,148 | 2,853,432 |
| Arkansas | 1,269 | 1,196,808 |
| California | 6,260 | 14,028,875 |
| Colorado | 867 | 2,401,568 |
| Connecticut | 690 | 1,428,409 |
| Delaware | 726 | 382,098 |
| District of Columbia | 1,280 | 324,060 |
| Florida | 3,292 | 8,909,506 |
| Georgia | 1,572 | 4,139,328 |
| Hawaii | 1,029 | 485,036 |
| Idaho | 1,052 | 686,778 |
| Illinois | 1,830 | 4,987,733 |
| Indiana | 1,091 | 2,706,641 |
| Iowa | 780 | 1,269,266 |
| Kansas | 851 | 1,148,825 |
| Kentucky | 754 | 1,806,643 |
| Louisiana | 1,648 | 1,900,332 |
| Maine | 524 | 574,834 |
| Maryland | 837 | 2,351,706 |
| Massachusetts | 1,354 | 2,760,267 |
| Michigan | 1,524 | 4,168,664 |
| Minnesota | 874 | 2,404,058 |
| Mississippi | 1,322 | 1,169,436 |
| Missouri | 897 | 2,480,031 |
| Montana | 1,157 | 449,799 |
| Nebraska | 812 | 752,294 |
| Nevada | 944 | 1,193,024 |
| New Hampshire | 819 | 542,568 |
| New Jersey | 1,359 | 3,278,378 |
| New Mexico | 1,349 | 823,790 |
| New York | 2,830 | 7,621,894 |
| North Carolina | 1,660 | 4,390,949 |
| North Dakota | 947 | 316,584 |
| Ohio | 1,605 | 4,684,656 |
| Oklahoma | 1,036 | 1,566,449 |
| Oregon | 989 | 1,725,868 |
| Pennsylvania | 1,744 | 5,167,733 |
| Rhode Island | 621 | 440,005 |
| South Carolina | 1,167 | 2,083,180 |
| South Dakota | 766 | 351,861 |
| Tennessee | 1,338 | 2,723,529 |
| Texas | 4,079 | 10,678,939 |
| Utah | 965 | 1,032,470 |
| Vermont | 841 | 265,566 |
| Virginia | 1,268 | 3,373,009 |
| Washington | 1,243 | 2,934,048 |
| West Virginia | 1,351 | 739,569 |
| Wisconsin | 883 | 2,423,652 |
| Wyoming | 919 | 237,067 |
Individual Income by State
While household income is a better measure of affluence, individual income is a fairer way to compare between people. By default, individual income is normalized – while there are cost of living differences, there's no comparing a one-earner family in Oklahoma to a hacker house in San Francisco (or whatever other wacky scenario you can dream up).
Just like with household income, let's lead off with the average individual income by state then talk about the median and top 1%. You can find more information on individual income statistics here.
Average Individual Income by State
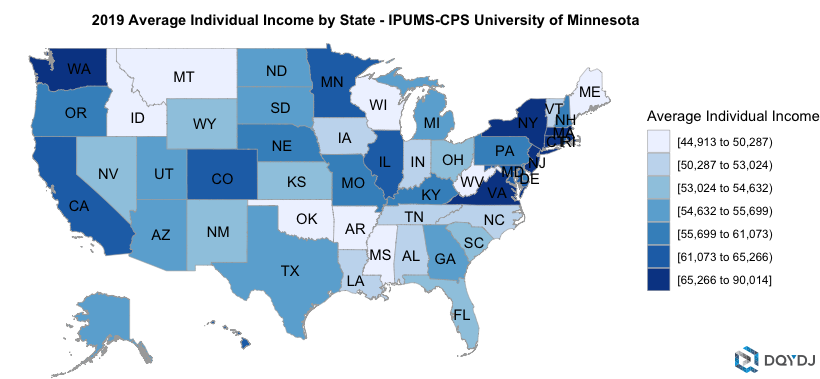
Once again, I have to warn you - average income is skewed by higher earners. The average individual income in America in 2019 was $58,379.45. That income would put someone in the 66th percentile of individual earnings – so only 1/3 of American workers make more.
Here's how the average individual income by state shakes out:
| State | Average Individual Income |
| Alabama | $50,286.94 |
| Alaska | $55,590.93 |
| Arizona | $54,678.99 |
| Arkansas | $47,713.22 |
| California | $62,695.45 |
| Colorado | $62,712.11 |
| Connecticut | $69,556.64 |
| Delaware | $56,161.81 |
| District of Columbia | $90,013.72 |
| Florida | $53,993.12 |
| Georgia | $54,689.97 |
| Hawaii | $61,800.56 |
| Idaho | $48,007.86 |
| Illinois | $61,957.40 |
| Indiana | $50,842.49 |
| Iowa | $51,763.54 |
| Kansas | $54,065.48 |
| Kentucky | $57,752.29 |
| Louisiana | $52,349.35 |
| Maine | $48,797.00 |
| Maryland | $64,840.89 |
| Massachusetts | $72,352.63 |
| Michigan | $54,632.12 |
| Minnesota | $61,072.55 |
| Mississippi | $44,913.28 |
| Missouri | $56,185.39 |
| Montana | $48,907.27 |
| Nebraska | $55,698.77 |
| Nevada | $53,713.09 |
| New Hampshire | $58,939.52 |
| New Jersey | $72,209.43 |
| New Mexico | $53,023.63 |
| New York | $66,265.72 |
| North Carolina | $51,939.19 |
| North Dakota | $55,285.00 |
| Ohio | $54,406.06 |
| Oklahoma | $49,770.21 |
| Oregon | $58,556.37 |
| Pennsylvania | $57,129.88 |
| Rhode Island | $61,366.45 |
| South Carolina | $54,595.77 |
| South Dakota | $55,242.63 |
| Tennessee | $52,518.60 |
| Texas | $55,079.66 |
| Utah | $54,636.20 |
| Vermont | $52,407.50 |
| Virginia | $68,058.62 |
| Washington | $65,265.92 |
| West Virginia | $47,398.82 |
| Wisconsin | $50,101.16 |
| Wyoming | $53,248.20 |
Median Individual Income by State
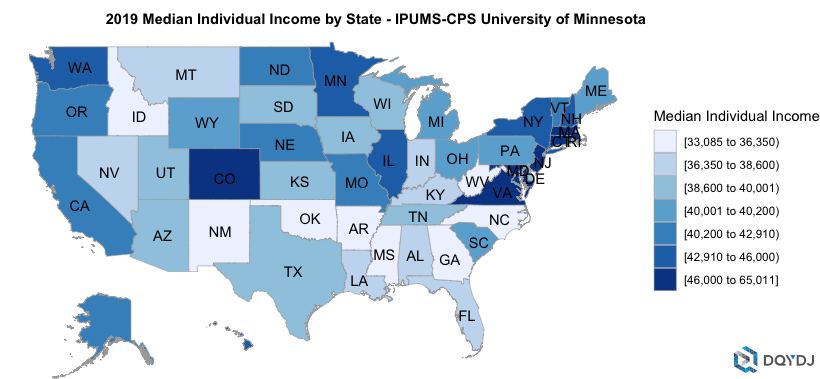
Again, median individual incomes are a better measure for most scholarship. For anyone in the workforce, median income means half of people make more while half make less – it's more representative than simple average income.
Here's the median income by state for every state plus D.C:
| State | Median Individual Income |
| Alabama | $36,444.00 |
| Alaska | $41,601.00 |
| Arizona | $40,000.00 |
| Arkansas | $35,050.00 |
| California | $40,501.00 |
| Colorado | $46,000.00 |
| Connecticut | $49,051.00 |
| Delaware | $39,025.00 |
| District of Columbia | $65,011.00 |
| Florida | $37,002.00 |
| Georgia | $36,000.00 |
| Hawaii | $45,001.00 |
| Idaho | $35,010.00 |
| Illinois | $43,010.00 |
| Indiana | $38,001.00 |
| Iowa | $38,600.00 |
| Kansas | $39,000.00 |
| Kentucky | $38,561.00 |
| Louisiana | $38,110.00 |
| Maine | $40,135.00 |
| Maryland | $50,000.00 |
| Massachusetts | $50,100.00 |
| Michigan | $40,001.00 |
| Minnesota | $45,301.00 |
| Mississippi | $33,501.00 |
| Missouri | $41,000.00 |
| Montana | $36,350.00 |
| Nebraska | $40,533.00 |
| Nevada | $37,590.00 |
| New Hampshire | $45,010.00 |
| New Jersey | $50,000.00 |
| New Mexico | $33,085.00 |
| New York | $44,160.00 |
| North Carolina | $36,325.00 |
| North Dakota | $40,200.00 |
| Ohio | $40,100.00 |
| Oklahoma | $36,000.00 |
| Oregon | $42,000.00 |
| Pennsylvania | $40,014.00 |
| Rhode Island | $42,910.00 |
| South Carolina | $40,001.00 |
| South Dakota | $40,000.00 |
| Tennessee | $39,150.00 |
| Texas | $39,001.00 |
| Utah | $39,002.00 |
| Vermont | $42,051.00 |
| Virginia | $47,065.00 |
| Washington | $45,711.00 |
| West Virginia | $36,000.00 |
| Wisconsin | $40,000.00 |
| Wyoming | $40,012.00 |
Top 1% Individual Income by State
And of course, because it comes up so often, I also ran the numbers on top 1% individual incomes by state. To read this table, you would need to make this much (or more) as an individual to be the top 1% in a state.
(Be a bit more skeptical of these numbers, there are by definition fewer samples at the top).
| State | Top 1% Individual Income |
| Alabama | $265,011.00 |
| Alaska | $270,000.00 |
| Arizona | $286,400.00 |
| Arkansas | $250,602.00 |
| California | $373,295.00 |
| Colorado | $288,700.00 |
| Connecticut | $617,000.00 |
| Delaware | $345,825.00 |
| District of Columbia | $488,700.00 |
| Florida | $323,375.00 |
| Georgia | $301,587.00 |
| Hawaii | $436,119.00 |
| Idaho | $223,013.00 |
| Illinois | $400,000.00 |
| Indiana | $256,050.00 |
| Iowa | $280,100.00 |
| Kansas | $298,401.00 |
| Kentucky | $452,500.00 |
| Louisiana | $263,400.00 |
| Maine | $244,090.00 |
| Maryland | $323,255.00 |
| Massachusetts | $413,489.00 |
| Michigan | $270,001.00 |
| Minnesota | $321,370.00 |
| Mississippi | $214,405.00 |
| Missouri | $290,050.00 |
| Montana | $261,600.00 |
| Nebraska | $275,342.00 |
| Nevada | $317,000.00 |
| New Hampshire | $280,400.00 |
| New Jersey | $500,002.00 |
| New Mexico | $600,152.00 |
| New York | $403,960.00 |
| North Carolina | $301,025.00 |
| North Dakota | $300,890.00 |
| Ohio | $302,505.00 |
| Oklahoma | $235,000.00 |
| Oregon | $323,176.00 |
| Pennsylvania | $350,000.00 |
| Rhode Island | $330,001.00 |
| South Carolina | $300,011.00 |
| South Dakota | $326,455.00 |
| Tennessee | $296,001.00 |
| Texas | $304,500.00 |
| Utah | $280,001.00 |
| Vermont | $242,277.00 |
| Virginia | $399,100.00 |
| Washington | $339,280.00 |
| West Virginia | $256,000.00 |
| Wisconsin | $215,198.00 |
| Wyoming | $307,810.00 |
Individual Income by State Methodology and Estimated Households
The sourcing is the same as above: microdata from the ASEC survey harmonized by the University of Minnesota.
Sarah Flood, Miriam King, Renae Rodgers, Steven Ruggles and J. Robert Warren. Integrated Public Use Microdata Series, Current Population Survey: Version 6.0 [dataset]. Minneapolis, MN: IPUMS, 2019. https://doi.org/10.18128/D030.V6.0
The art is in identifying "workers". Since this is data over an entire year, our workers measure will not match, for example, an individual month's employment survey.
Here's the criteria (each is an 'or'):
- Match workforce variable (worked at some point in year)
- Wanted or maybe wanted a job
- Worked >= 1 hour in a typical week
For more on the screen, see our average individual income article.
Individual Income by State Data Quality and Estimated Workforce
Like with households, you sacrifice resolution when cutting your data into individual states. This table lists the number of samples which went into the estimates above, followed by the estimated workforce after weighting.
| State | Samples | Estimated Workforce |
| Alabama | 1,663 | 2,403,134 |
| Alaska | 1,141 | 391,436 |
| Arizona | 1,585 | 3,832,031 |
| Arkansas | 1,569 | 1,440,085 |
| California | 9,379 | 20,593,202 |
| Colorado | 1,265 | 3,330,240 |
| Connecticut | 939 | 1,856,757 |
| Delaware | 994 | 531,313 |
| District of Columbia | 1,637 | 429,285 |
| Florida | 4,086 | 10,705,854 |
| Georgia | 2,054 | 5,475,473 |
| Hawaii | 1,519 | 753,890 |
| Idaho | 1,523 | 948,359 |
| Illinois | 2,668 | 6,954,686 |
| Indiana | 1,480 | 3,659,576 |
| Iowa | 1,204 | 1,849,207 |
| Kansas | 1,189 | 1,551,594 |
| Kentucky | 902 | 2,184,025 |
| Louisiana | 2,013 | 2,256,518 |
| Maine | 686 | 733,900 |
| Maryland | 1,302 | 3,616,401 |
| Massachusetts | 2,069 | 4,086,509 |
| Michigan | 2,020 | 5,339,887 |
| Minnesota | 1,287 | 3,415,512 |
| Mississippi | 1,508 | 1,349,644 |
| Missouri | 1,227 | 3,264,765 |
| Montana | 1,526 | 559,361 |
| Nebraska | 1,220 | 1,103,871 |
| Nevada | 1,328 | 1,627,421 |
| New Hampshire | 1,270 | 828,917 |
| New Jersey | 1,927 | 4,681,244 |
| New Mexico | 1,636 | 1,000,500 |
| New York | 3,911 | 10,532,290 |
| North Carolina | 2,179 | 5,569,233 |
| North Dakota | 1,350 | 436,074 |
| Ohio | 2,145 | 6,235,759 |
| Oklahoma | 1,376 | 1,999,904 |
| Oregon | 1,391 | 2,262,081 |
| Pennsylvania | 2,367 | 6,854,472 |
| Rhode Island | 808 | 579,228 |
| South Carolina | 1,450 | 2,618,224 |
| South Dakota | 1,083 | 466,572 |
| Tennessee | 1,791 | 3,549,916 |
| Texas | 5,735 | 14,894,517 |
| Utah | 1,621 | 1,683,083 |
| Vermont | 1,171 | 362,474 |
| Virginia | 1,795 | 4,648,299 |
| Washington | 1,889 | 4,273,467 |
| West Virginia | 1,596 | 850,299 |
| Wisconsin | 1,274 | 3,424,813 |
| Wyoming | 1,200 | 302,339 |
Diving Deep on State Incomes
While we do have an income percentile by state calculator, this is the first time we've systematically approached income by state research.
(Apologies for the oversight!)
State is a reasonable breakdown, however. States are so-called "laboratories of democracy" and minor differences in laws have very different consequences for the cost of living – and incomes earned – from one state to the next.
It's hard to argue that a top 1% countrywide income in Wyoming vs. New York is the same thing. True, income percentile by city is even better. But state is a pretty good slice.
What's your take on the data?
