
Here's an income by city comparison calculator with statistics such as average income by city and median income by city for the United States in 2026. It includes data for 239 metro areas, plus a catch-all for everywhere else. You can compare or filter on either household or individual income.
Income percentile by city calculator
Enter an annual income to see how it compares in various metro areas in the United States. If you click or tap in the "Compare Cities" entry field, you can add multiple metropolitan areas.
Note: some cities have sufficient data to show all income percentiles, while others only show deciles.
Using the income percentile by city calculator
- First, choose to compare individual income or income earned by a household.
- Next, pick the closest city or metro area (you can also search on state abbreviation).
- Optionally, add any other metro areas to the comparison.
Income percentile by city tool input options
Here are the fine details on the metro area calculator:
- Income: Gross, pre-tax income earned by one individual or a household. Income is from any source on this list.
- Individual or Household: Choose whether you want to compare an individual or household income, to match the income you input.
- City: The metro area where you would like to compare an income.
- Compare Cities: Optionally, add other metro areas to see how an income would compare with the percentiles there.
Warning: A city marked with ˟ lacks sufficient data to show all income percentiles. Even cities that show the top 1% are often pushing the results. Don't look at that data as exact, but somewhere in the ballpark.
Income percentile by city tool output
There are two primary outputs:
- The visualization of income distribution in your selected city (including any others you add)
- An estimated income percentile (or decile, for metros with fewer survey responses)
Individual income percentile by city statistics
Here are tables with summary statistics for individual income by city. Income is pre-tax, earned between January and December 2025.
Find average income by city, median income by city, population, and the 90th percentile at a glance. Click the column toggles above the table to add the number of workers, the 25th and 75th percentiles, top 1% individual income (for metros with enough data points), and samples.
Use the search box up top to find a city.
Household income percentile by city statistics
In the below filterable table are summary statistics for household income by city. All values are gross, pre-tax income earned between January and December 2025.
Find average income, median income, population, and the 90th percentile for each metro area in the United States. Use the column toggles to add the number of metro households, the 25th and 75th percentiles, top 1% household income (for metros with enough data points), and samples.
Median household income in the largest metro areas
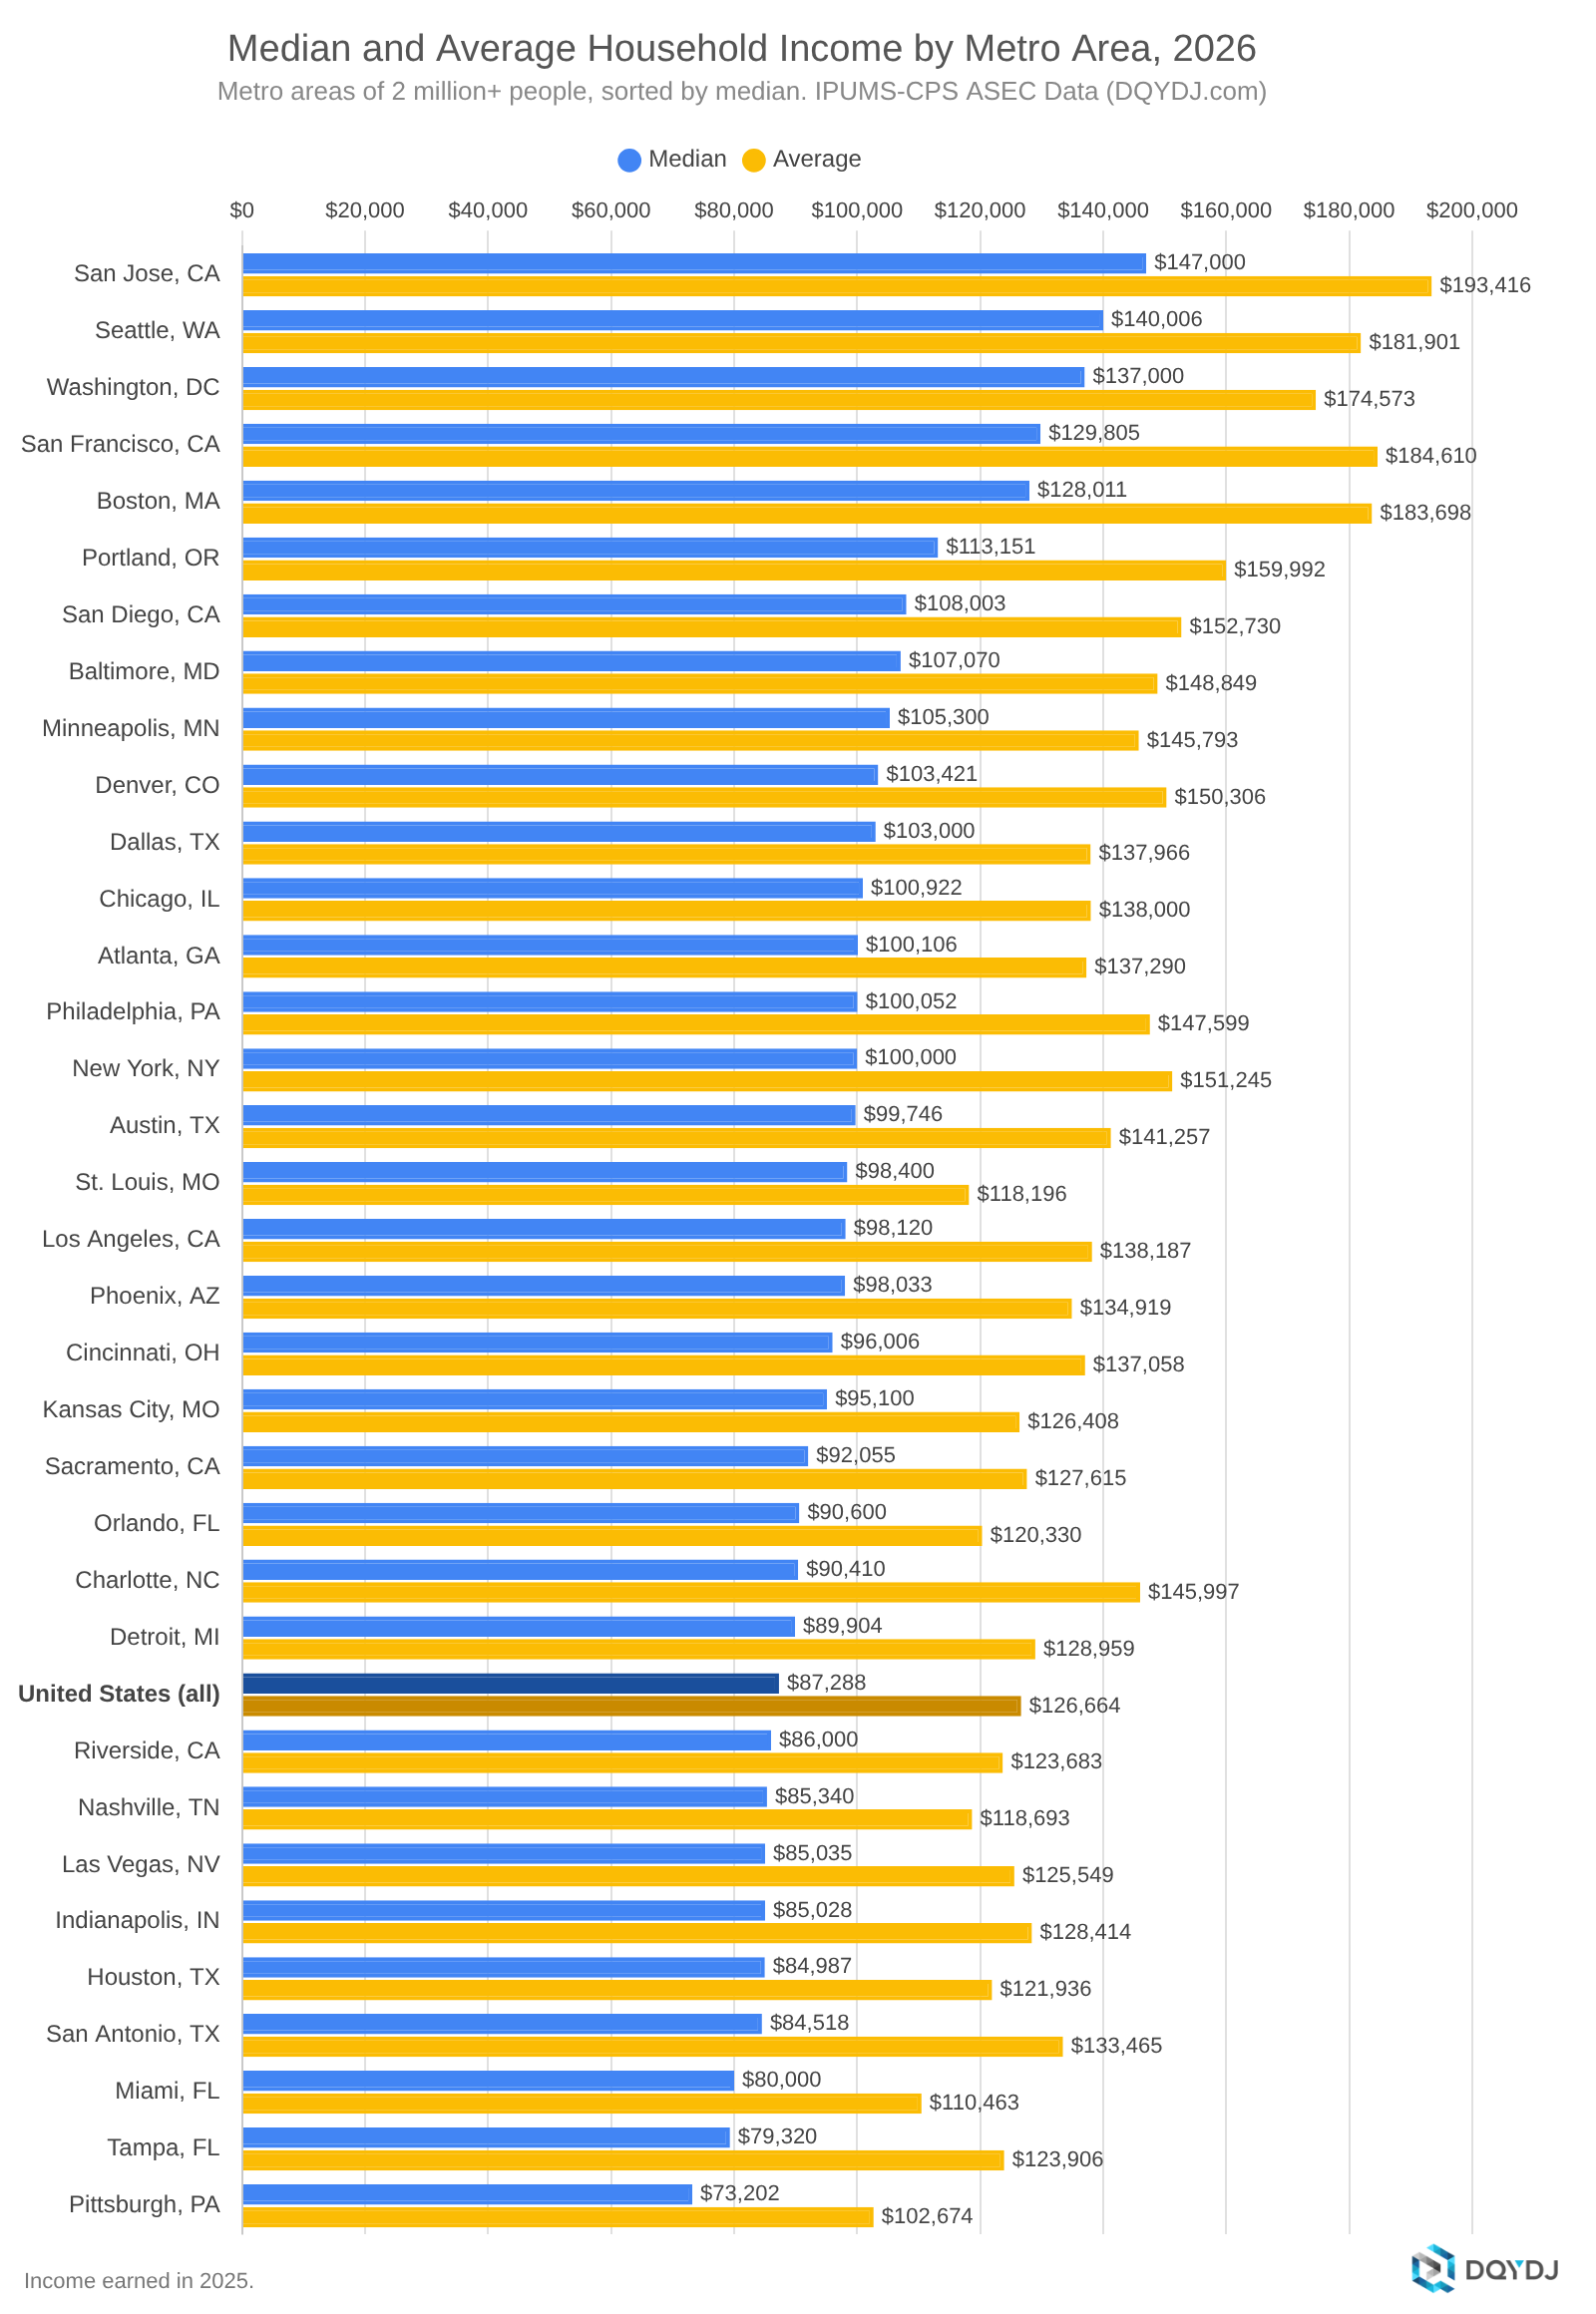
Prefer your stats in graphic form? Here's median household income in the 34 metro areas with at least 2 million people. (Tap or click to zoom.)
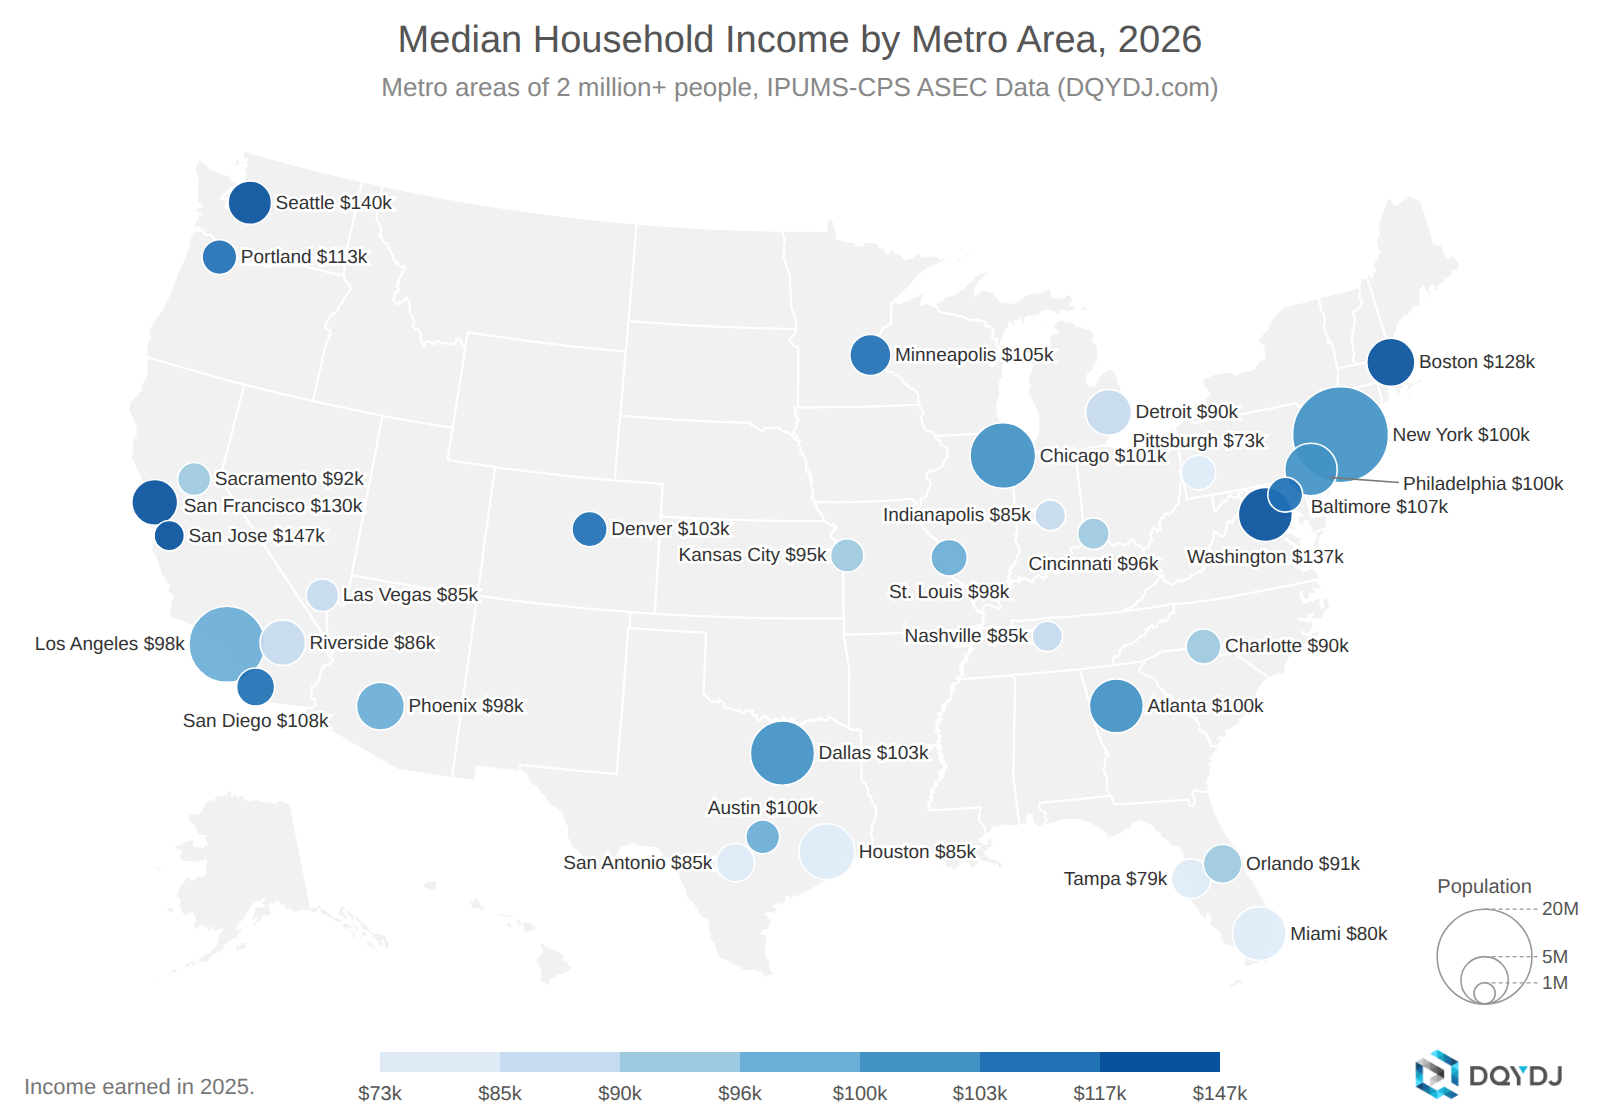
San Jose had the highest median household income from this set at $147,000, and 25 of the 34 beat the national median household income of $87,288.
The only way to get the average into a graphic was to switch to bars. This chart shows the average and median household income for all 34 (plus the US aggregate), sorted by median.
Source and methodology on the 2026 income percentile by city calculator
Our source for the income percentile by city calculator was IPUMS-CPS:
Sarah Flood, Miriam King, Renae Rodgers, Steven Ruggles, J. Robert Warren, Daniel Backman, Etienne Breton, Grace Cooper, Julia A. Rivera Drew, Stephanie Richards, David Van Riper, and Kari C.W. Williams. IPUMS CPS: Version 13.0 [dataset]. Minneapolis, MN: IPUMS, 2025. https://doi.org/10.18128/D030.V13.0
For my methodology on incomes and worker definition, see the source articles:
- Average household income (and read the definition of household from IPUMS.)
- Average individual income
Metro area and city definitions and warnings
A city in our income definition is a metropolitan area defined by IPUMS. There are generally enough samples for low-resolution income distribution estimates – average and median should be reasonably accurate for all but the smallest metros! – but you need to be cautious when interpreting the tools. Directly from the Census Bureau:
"One set of estimates that can be produced from CPS microdata files should be treated with caution. These are estimates for individual metropolitan areas. Although estimates for the larger areas such as New York, Los Angeles, and so forth, should be fairly accurate and valid for a multitude of uses, estimates for the smaller metropolitan areas (those with populations under 500,000) should be used with caution because of the relatively large sampling variability associated with these estimates."
In the tools, I've set the minimum number of data points to show full percentiles and the top 1% estimate for households or individuals as 300 data points for the worker survey (note there may be fewer than 300 households).
Metros with fewer than 30 worker data points, along with rural areas and metros the Census Bureau doesn't identify, are bucketed in Nonmetro, unidentified, or small-sample areas.
Starting with the 2026 data, the Census Bureau uses updated metro area definitions, so some metros have new names (and some have new boundaries). Austin, for example, is now Austin-Round Rock-San Marcos. Keep the changes in mind if you compare with past versions of this tool.
If you check the tables in the household and individual income section above, you can find the number of data points used to guess the brackets, and decide whether that is sufficient for a good estimate. You may also want to check out the income topcodes for this year's data.
In short: be cautious, especially for the upper few percent.
Past results:
