
On this page, find United States average individual income by race and ethnicity and median individual income by race and ethnicity in 2022. You'll also find the top 1% individual income by race and ethnicity and an income by race and ethnicity calculator (and visualization). Incomes are earned between January and December 2021.
Optionally, plot multiple races and ethnicities in the tool to visualize income inequality by race.
We have statistics for:
- White Non-Hispanic
- Hispanic or Latino of any Race
- Black
- Asian
- American Indian
- Pacific Islander
- Two or More Races
Average, Median, and Top 1% Income by Race and Hispanic Origin
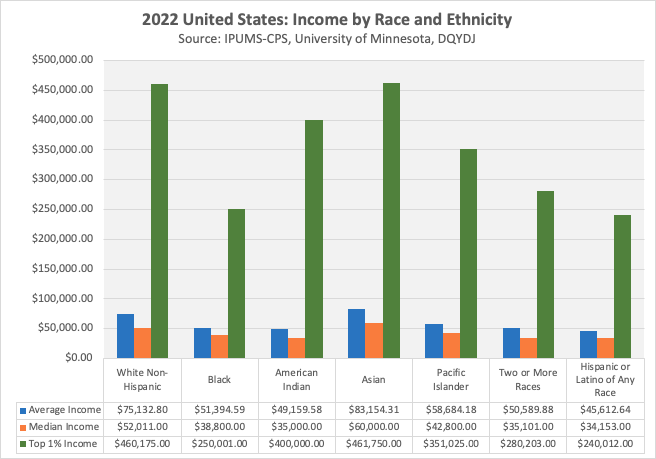
This table contains the average, median, and top 1% individual income for selected races and ethnicities. Country-wide, the average individual income was $66,755.25, the median income was $46,001.00, and the top 1% income was $401,622.00 in 2022.
| Race/Ethnicity | Average Income | Median Income | Top 1% Income |
| White Non-Hispanic | $75,132.80 | $52,011.00 | $460,175.00 |
| Black | $51,394.59 | $38,800.00 | $250,001.00 |
| American Indian | $49,159.58 | $35,000.00 | $400,000.00 |
| Asian | $83,154.31 | $60,000.00 | $461,750.00 |
| Pacific Islander | $58,684.18 | $42,800.00 | $351,025.00 |
| Two or More Races | $50,589.88 | $35,101.00 | $280,203.00 |
| Hispanic or Latino of Any Race | $45,612.64 | $34,153.00 | $240,012.00 |
Here's that data in graphical form – top 1% income, average income, and median individual income by race or ethnicity.
Race and Ethnicity Income Visualization, Comparison, and Tool
Below is a calculator for income percentile by race and ethnicity. Enter race or ethnicity and income earned in full-year 2021, and we'll plot it against other earners in the same cohort. Additionally, you can visualize income inequality by race by adjusting the comparison field.
Income Percentile by Race and Ethnicity Methodology
This data uses 2022 IPUMS-CPS data to calculate incomes. See the income percentile calculator for more details and a description of my "worker" screen.
Sarah Flood, Miriam King, Renae Rodgers, Steven Ruggles and J. Robert Warren. Integrated Public Use Microdata Series, Curhttps:/Sarah Flood, Miriam King, Renae Rodgers, Steven Ruggles, J. Robert Warren and Michael Westberry. Integrated Public Use Microdata Series, Current Population Survey: Version 9.0 [dataset]. Minneapolis, MN: IPUMS, 2021. https://doi.org/10.18128/D030.V9.0
Workforce Size by Race
The next table shows how many samples I used
| Race/Ethnicity | Samples | Estimated Workers |
| White Non-Hispanic | 46,618 | 106,874,020 |
| Black | 8,497 | 20,936,666 |
| American Indian | 852 | 1,294,019 |
| Asian | 5,495 | 11,214,391 |
| Pacific Islander | 425 | 618,933 |
| Two or More Races | 1,395 | 2,697,575 |
| Hispanic or Latino of Any Race | 15,859 | 32,458,540 |
Interested in past data? Find previous editions here:
