
In our last post we had an interesting breakdown of an oft-overlooked piece of financial reporting: revenues. Furthermore, revenues per sector... and even further, normalized and inflation adjusted to tell us the full story on all of the major economic sectors since Q2-2009. You know, in the S&P 500 anyway.
Go On...
Smart readers (and dumb readers, actually, now that I mention it) know that revenues are only some of the story. The story is very long, so I won't be telling the whole thing... but we need to at least discuss earnings.
At a basic level, earnings are what drive the stock market. The value of a stock, in theory, is the sum of current earnings paid out in dividends and all future earnings (and, uh, dividends.) The observation that earnings grow at somewhat reasonable rates on a long enough timeline (and that what you pay for those earnings does matter) even won Robert Shiller a Nobel Prize in Economics. You know, which trickled down to our S&P 500 Dividend Return calculator, so on, etc.
Enter Margins.
Earnings divided by revenue? We call that the profit 'margin', and although we do expect them to vary somewhat year to year it has recently been elevated for the economy as a whole.
That could mean any number of things - lack of access to (possibly highly skilled) talent, lack of competition, complex tax strategies, productivity increases in the face of pay decreases (or less workers), and so on.
So, how does it look? You tell me:
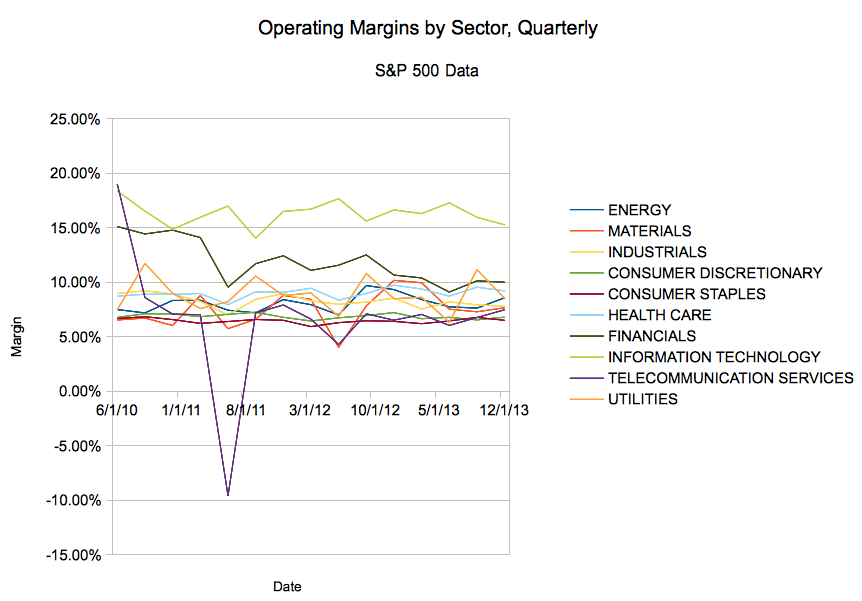
Marginal Revolution
Okay, admittedly, that's a lot of data crammed into a small chart. Here's the message: 6% margins should be considered something like your baseline. We don't have a ton of data on sector margins going back too long, but here's something which should worry you (4th quarter estimates):
| ENERGY | MATERIALS | INDUSTRIALS | CONSUMER DISCRETIONARY | CONSUMER STAPLES | HEALTH CARE | FINANCIALS | INFORMATION TECHNOLOGY | TELECOMMUNICATION SERVICES | UTILITIES | |
| Q4-Est | 8.57% | 7.66% | 7.79% | 6.79% | 6.50% | 9.20% | 10.00% | 15.26% | 7.47% | 8.51% |
There you go - it's a margin party, and no one was turned away at the door. Every single sector is seeing greater than 6% margins.
So... opportunity for a bunch of upstarts to enter the market and ruthlessly cut prices, or fundamental shift in the American economy due to pick your bogeyman?
I don't know - but it does help visually explain how non-impressive revenue growth can lead to impressive earnings. I just can't tell you with a straight face that I think it's something sustainable.
