
Below are estimated United States salary brackets for 2022. See estimates for the average, median, and top 1% wage or salary in the United States.
(Salaries are earned between January and December 2021.)
Salary Benchmarks in 2022
The most popular salary statistics to compare are:
- Median salary
- Average salary
- Top 1% salary
The median salary is the most important – even though it is the smallest of the three. Half of all workers make more, and half make less than the median.
What is the median salary?
The median salary in the United States in 2022 was $50,000.
What is the average salary?
In 2022, the average salary in the United States was $68,238.68
What is the top 1% salary?
$350,000 was the threshold to earn a top 1% salary in 2022.
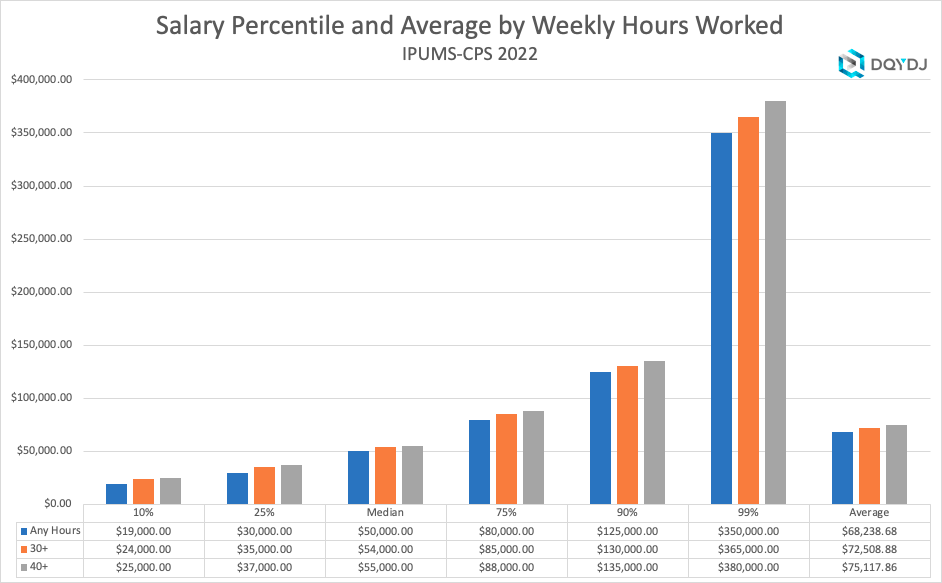
Salary Percentiles for the United States in 2022
Summaries are nice – but a complete view is better. Below is a chart summarizing every salary percentile in 2022. The first column is for all workers, while the second and third limit the population to only those who work 30+ or 40+ hours in a normal week.
| Salary Percentile | Any Hours | 30+ | 40+ |
| 1% | $5,000.00 | $8,000.00 | $9,600.00 |
| 2% | $7,100.00 | $12,000.00 | $14,000.00 |
| 3% | $9,600.00 | $15,000.00 | $16,000.00 |
| 4% | $11,000.00 | $16,000.00 | $18,000.00 |
| 5% | $12,400.00 | $18,000.00 | $20,000.00 |
| 6% | $14,000.00 | $20,000.00 | $20,007.00 |
| 7% | $15,000.00 | $20,000.00 | $22,000.00 |
| 8% | $16,000.00 | $21,000.00 | $24,000.00 |
| 9% | $18,000.00 | $22,500.00 | $25,000.00 |
| 10% | $19,000.00 | $24,000.00 | $25,000.00 |
| 11% | $20,000.00 | $25,000.00 | $26,000.00 |
| 12% | $20,000.00 | $25,000.00 | $27,000.00 |
| 13% | $21,140.00 | $25,002.00 | $28,000.00 |
| 14% | $22,500.00 | $27,000.00 | $30,000.00 |
| 15% | $24,000.00 | $28,000.00 | $30,000.00 |
| 16% | $24,950.00 | $29,000.00 | $30,000.00 |
| 17% | $25,000.00 | $30,000.00 | $30,000.00 |
| 18% | $25,000.00 | $30,000.00 | $31,200.00 |
| 19% | $26,000.00 | $30,000.00 | $32,000.00 |
| 20% | $27,500.00 | $30,000.00 | $33,002.00 |
| 21% | $28,000.00 | $32,000.00 | $35,000.00 |
| 22% | $30,000.00 | $32,200.00 | $35,000.00 |
| 23% | $30,000.00 | $34,000.00 | $35,000.00 |
| 24% | $30,000.00 | $35,000.00 | $36,000.00 |
| 25% | $30,000.00 | $35,000.00 | $37,000.00 |
| 26% | $31,000.00 | $35,000.00 | $38,000.00 |
| 27% | $32,000.00 | $36,000.00 | $39,000.00 |
| 28% | $33,000.00 | $37,000.00 | $40,000.00 |
| 29% | $35,000.00 | $38,000.00 | $40,000.00 |
| 30% | $35,000.00 | $39,000.00 | $40,000.00 |
| 31% | $35,000.00 | $40,000.00 | $40,000.00 |
| 32% | $36,000.00 | $40,000.00 | $41,600.00 |
| 33% | $37,000.00 | $40,000.00 | $42,000.00 |
| 34% | $38,000.00 | $40,000.00 | $43,000.00 |
| 35% | $39,000.00 | $42,000.00 | $45,000.00 |
| 36% | $40,000.00 | $42,000.00 | $45,000.00 |
| 37% | $40,000.00 | $44,000.00 | $45,000.00 |
| 38% | $40,000.00 | $45,000.00 | $46,000.00 |
| 39% | $40,990.00 | $45,000.00 | $47,742.00 |
| 40% | $42,000.00 | $45,000.00 | $48,000.00 |
| 41% | $43,000.00 | $47,000.00 | $50,000.00 |
| 42% | $44,238.00 | $48,000.00 | $50,000.00 |
| 43% | $45,000.00 | $49,000.00 | $50,000.00 |
| 44% | $45,000.00 | $50,000.00 | $50,000.00 |
| 45% | $46,000.00 | $50,000.00 | $50,000.00 |
| 46% | $48,000.00 | $50,000.00 | $52,000.00 |
| 47% | $48,456.00 | $50,000.00 | $53,000.00 |
| 48% | $50,000.00 | $51,000.00 | $54,900.00 |
| 49% | $50,000.00 | $52,000.00 | $55,000.00 |
| 50% | $50,000.00 | $54,000.00 | $55,000.00 |
| 51% | $50,000.00 | $55,000.00 | $56,500.00 |
| 52% | $51,000.00 | $55,000.00 | $58,000.00 |
| 53% | $52,000.00 | $56,000.00 | $60,000.00 |
| 54% | $54,000.00 | $58,000.00 | $60,000.00 |
| 55% | $55,000.00 | $60,000.00 | $60,000.00 |
| 56% | $55,000.00 | $60,000.00 | $60,000.00 |
| 57% | $57,000.00 | $60,000.00 | $61,000.00 |
| 58% | $58,240.00 | $60,000.00 | $63,000.00 |
| 59% | $60,000.00 | $61,000.00 | $65,000.00 |
| 60% | $60,000.00 | $63,000.00 | $65,000.00 |
| 61% | $60,000.00 | $65,000.00 | $66,000.00 |
| 62% | $60,000.00 | $65,000.00 | $68,500.00 |
| 63% | $62,019.00 | $66,560.00 | $70,000.00 |
| 64% | $65,000.00 | $69,000.00 | $70,000.00 |
| 65% | $65,000.00 | $70,000.00 | $70,501.00 |
| 66% | $66,200.00 | $70,000.00 | $72,000.00 |
| 67% | $69,000.00 | $71,600.00 | $75,000.00 |
| 68% | $70,000.00 | $73,000.00 | $75,000.00 |
| 69% | $70,000.00 | $75,000.00 | $77,000.00 |
| 70% | $72,000.00 | $75,000.00 | $80,000.00 |
| 71% | $75,000.00 | $78,000.00 | $80,000.00 |
| 72% | $75,000.00 | $80,000.00 | $80,002.00 |
| 73% | $77,000.00 | $80,000.00 | $84,000.00 |
| 74% | $80,000.00 | $82,000.00 | $85,000.00 |
| 75% | $80,000.00 | $85,000.00 | $88,000.00 |
| 76% | $81,500.00 | $86,200.00 | $90,000.00 |
| 77% | $85,000.00 | $90,000.00 | $90,800.00 |
| 78% | $86,000.00 | $90,000.00 | $95,000.00 |
| 79% | $90,000.00 | $94,000.00 | $97,992.00 |
| 80% | $90,000.00 | $96,000.00 | $100,000.00 |
| 81% | $95,000.00 | $100,000.00 | $100,000.00 |
| 82% | $98,000.00 | $100,000.00 | $100,000.00 |
| 83% | $100,000.00 | $100,000.00 | $105,000.00 |
| 84% | $100,000.00 | $105,000.00 | $109,824.00 |
| 85% | $102,000.00 | $110,000.00 | $110,002.00 |
| 86% | $108,000.00 | $112,000.00 | $118,000.00 |
| 87% | $110,000.00 | $120,000.00 | $120,000.00 |
| 88% | $118,000.00 | $120,000.00 | $125,000.00 |
| 89% | $120,000.00 | $125,000.00 | $130,000.00 |
| 90% | $125,000.00 | $130,000.00 | $135,000.00 |
| 91% | $130,000.00 | $139,000.00 | $142,000.00 |
| 92% | $140,000.00 | $148,000.00 | $150,000.00 |
| 93% | $150,000.00 | $150,000.00 | $150,800.00 |
| 94% | $150,002.00 | $160,000.00 | $165,000.00 |
| 95% | $167,348.00 | $175,000.00 | $180,000.00 |
| 96% | $186,000.00 | $200,000.00 | $200,000.00 |
| 97% | $203,000.00 | $212,000.00 | $220,000.00 |
| 98% | $250,000.00 | $250,000.00 | $260,000.00 |
| 99% | $350,000.00 | $365,000.00 | $380,000.00 |
Salary vs. Income
Salary is the amount of money someone is paid in wages at a job. However, it's only one element of income.
Many people earn money through other means – everything from rentals, investments, to interest, to farms and businesses. Adding up all of those categories leads to income, a better view of spending power than merely looking at a salary. Find our income posts here. (Including household income and individual income).
Methodology on 2022 United States Salary Brackets
Data comes from the United States Census Bureau's Annual ASEC survey, released in September 2022. Here are the criteria:
- AGE >= 16
- CLASSWKR >= 20 and CLASSWKR <= 28
- WKSWORK1 at least 40 weeks
- WORKLY is 2, or the person 'wants' a job
Additionally, the two other categories of full-time workers set the respective floor on hours worked. For all columns, you're only seeing INCWAGE – wage and salary income.
This screen leaves us with 57,139 responses, representing 126,936,619 people who earned a wage and worked 40 or more weeks in 2021.
Sarah Flood, Miriam King, Renae Rodgers, Steven Ruggles, J. Robert Warren and Michael Westberry. Integrated Public Use Microdata Series, Current Population Survey: Version 9.0 [dataset]. Minneapolis, MN: IPUMS, 2022. https://doi.org/10.18128/D030.V9.0
Past results:
Is this salary gross or net? Does this data include taxes?
The salary data in this post is before tax or gross salary.
