
On this page are estimated United States retirement savings. Statistics are for households headed by adults aged 32-61 at the time of the survey (results from 2022-2023).It's the newest United States data until September 2026.
You'll see average retirement savings, median retirement savings, top 1% retirement savings, and a retirement savings percentile calculator to rank a savings amount versus the adult population.
Perhaps more relevantly, later see our retirement savings by age post. For a fuller accounting of net worth in America (including assets such as businesses and real estate equity), see our net worth research and net worth by age research.
Retirement Savings Benchmarks in 2023
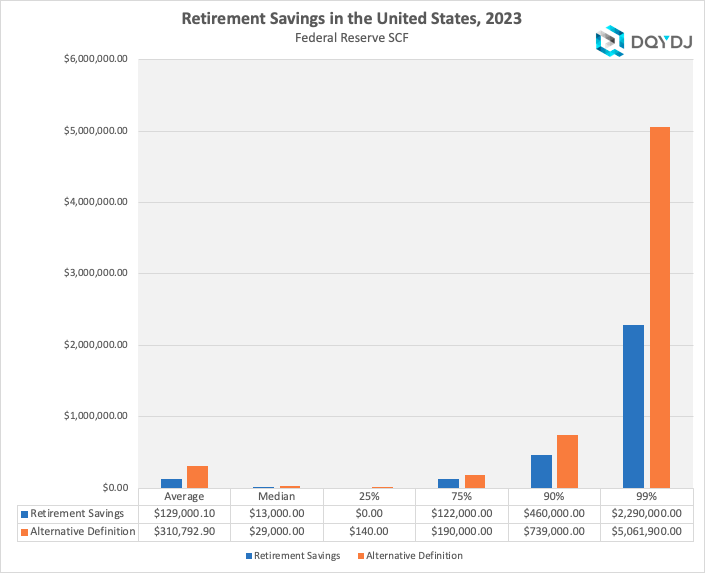
In 2023, American adults between 32 and 61 years old had on average $129,000.10 saved for retirement. Using an expansive definition, Americans averaged $310,792.90 in savings.
The median American adult had $13,000 using a strict reading of retirement savings, and $29,000 with the more expansive definition. The top 1% of households had $2,290,000 and $5,061,900 earmarked for retirement, respectively.
These numbers do not include estimated of social security value, the most common way people fund retirement today.
Americans with No Retirement Savings
A large number of American adults had no retirement savings whatsoever.
- 39.20% of American adults had no retirement savings
- 21.62% of American adults had no (or negative) retirement savings (even including the extended asset definition)
Retirement Savings Percentile Calculator
Want to compare an amount of retirement savings to the aggregate retirement savings for American adults? This tool has you covered.
In this tool, visualize retirement savings amounts versus other US households in 2023. Enter a retirement asset number and indicate if it's just strict retirement accounts or includes other assets. Then, hit calculate, and the tool will show you where it compares.
Retirement Savings Definitions and Methodology
Our data comes from the 2022 Survey of Consumer Finances (which includes survey responses from 2023, as well).
For this series, we define American adults as 32-61 years old. The average age at retirement in the United states is just shy of 60, with the median and mode a little higher. This is an excellent measure of 'adults' who mostly aren't retiring yet, and this group is also mostly no longer in training or education.
(It also matches the "adult" definition in the fine work done on retirement at the Economics Policy Institute.)
Also, note that the numbers include pensions with a cash payout component but does not capitalize periodic payouts without cash equivalents, such as Social Security. See the net worth post for more.
Strict Retirement Savings
For the strict definition, I use the variable RETQLIQ. (It's easiest to pull it yourself using Berkeley's SDA Tool).
In short, it includes IRAs, Keoghs, Pensions, and Thrift-type accounts (such as your 401(k) or 403(b)). However, these certainly aren't the only places people save for retirement. With that in mind, I also run the numbers for a more expansive definition of retirement savings.
Expansive Retirement Savings
For the expansive definition, start from FIN, or all financial assets. Then, remove checking accounts and prepaid cards. Next, eliminate whole life insurance and trusts, which are generally estate planning tools. Finally, remove miscellaneous assets – that's your baseball cards, silverware, and the like.
Here's the Berkeley financial asset flow chart [pdf] with my markups (red box = not included):
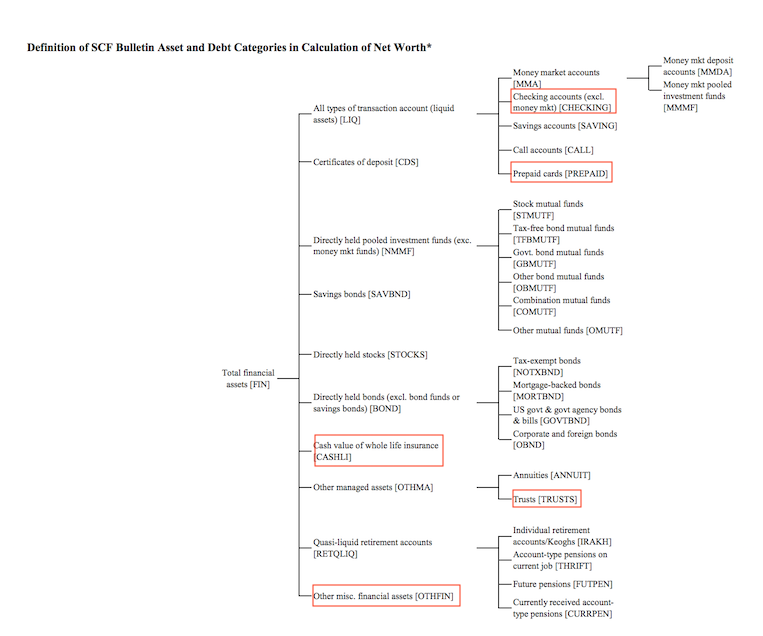
I don't present this methodology to argue that people can't, for example, have a miniature figurine collection to fund their retirement. My goal is not to cover every corner case of retirement savings – the aggregate numbers will be close enough for the post to be useful.
If you disagree with the categories, run your numbers yourself – it's straightforward to do using Berkeley's SDA Tool.
For past versions of this post, see here:
