
In this post are United States Salary Brackets by Age for 2022. You'll also find average salary by age, plus median and top 1% salaries by age.
Salaries/wage incomes are gross (pre-tax), earned between January and December 2021 (the survey was conducted in March 2022).
Salary Benchmarks by Age in 2022
Age is an excellent proxy for experience in most datasets – generally, the longer you've been at a job or career, the better you are in that job or career. While that's not a universal law, it's good practice to separate salary data by age. (Although you can find aggregate salary averages and stats here).
The best summary statistics for salary are:
- Median salary by age
- Average salary by age
- Top 1% salary by age
We'll hit each summary statistic in kind, but here's a quick visualization of the main salary breakpoints for selected ages.
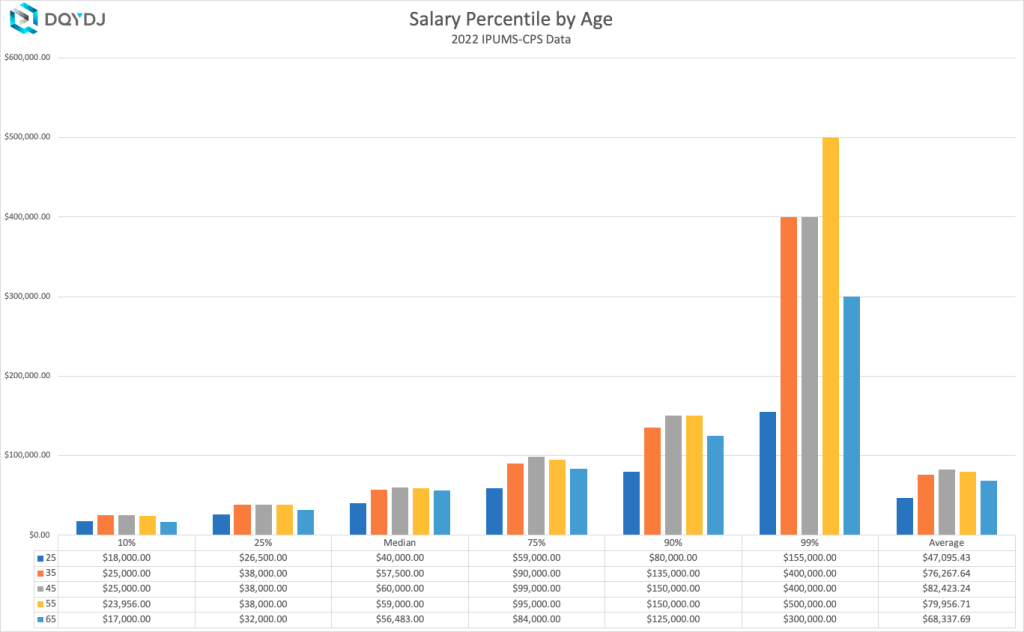
What is the median salary by age in the United States?
In full-year 2021 in the United States, these were the median salaries earned by age:
- Age 25: $40,000.00
- Age 35: $57,500.00
- Age 45: $60,000.00
- Age 55: $59,000.00
- Age 65: $56,483.00
The following table lists the median salary for every age from 16-70 in the United States for 2022:
| Age | Median Salary |
| 16 | $7,800.00 |
| 17 | $8,700.00 |
| 18 | $14,000.00 |
| 19 | $19,968.00 |
| 20 | $20,000.00 |
| 21 | $23,000.00 |
| 22 | $25,000.00 |
| 23 | $30,000.00 |
| 24 | $35,000.00 |
| 25 | $40,000.00 |
| 26 | $42,000.00 |
| 27 | $45,000.00 |
| 28 | $47,000.00 |
| 29 | $50,000.00 |
| 30 | $50,000.00 |
| 31 | $50,000.00 |
| 32 | $50,000.00 |
| 33 | $55,000.00 |
| 34 | $52,000.00 |
| 35 | $57,500.00 |
| 36 | $58,000.00 |
| 37 | $56,002.00 |
| 38 | $55,000.00 |
| 39 | $58,000.00 |
| 40 | $58,000.00 |
| 41 | $57,000.00 |
| 42 | $60,000.00 |
| 43 | $60,000.00 |
| 44 | $60,000.00 |
| 45 | $60,000.00 |
| 46 | $60,000.00 |
| 47 | $60,000.00 |
| 48 | $60,000.00 |
| 49 | $60,000.00 |
| 50 | $60,000.00 |
| 51 | $60,000.00 |
| 52 | $60,000.00 |
| 53 | $60,000.00 |
| 54 | $55,000.00 |
| 55 | $59,000.00 |
| 56 | $56,000.00 |
| 57 | $55,000.00 |
| 58 | $56,000.00 |
| 59 | $50,000.00 |
| 60 | $60,000.00 |
| 61 | $57,000.00 |
| 62 | $54,000.00 |
| 63 | $60,000.00 |
| 64 | $56,432.00 |
| 65 | $56,483.00 |
| 66 | $48,000.00 |
| 67 | $50,000.00 |
| 68 | $50,000.00 |
| 69 | $43,000.00 |
| 70 | $45,000.00 |
What is the average salary by age in the United States?
In full year 2021 in the United States, these were the average salaries earned by age:
- Age 25: $47,095.43
- Age 35: $76,267.64
- Age 45: $82,423.24
- Age 55: $79,956.71
- Age 65: $68,337.69
In this next table, I've summarized the average salary for every age from 16-70 in the United States in 2022:
| Age | Average Salary |
| 16 | $13,725.19 |
| 17 | $15,664.45 |
| 18 | $17,370.92 |
| 19 | $21,760.60 |
| 20 | $24,440.57 |
| 21 | $26,461.77 |
| 22 | $28,958.49 |
| 23 | $34,042.33 |
| 24 | $38,603.56 |
| 25 | $47,095.43 |
| 26 | $51,575.94 |
| 27 | $55,466.90 |
| 28 | $56,755.81 |
| 29 | $59,167.50 |
| 30 | $63,398.05 |
| 31 | $61,720.61 |
| 32 | $68,275.90 |
| 33 | $66,595.16 |
| 34 | $69,997.25 |
| 35 | $76,267.64 |
| 36 | $73,923.87 |
| 37 | $72,482.03 |
| 38 | $79,095.53 |
| 39 | $76,857.72 |
| 40 | $72,041.53 |
| 41 | $77,799.75 |
| 42 | $83,278.01 |
| 43 | $82,655.11 |
| 44 | $78,300.25 |
| 45 | $82,423.24 |
| 46 | $79,799.90 |
| 47 | $80,701.06 |
| 48 | $82,414.18 |
| 49 | $80,922.86 |
| 50 | $78,220.03 |
| 51 | $83,199.75 |
| 52 | $72,409.31 |
| 53 | $85,495.80 |
| 54 | $79,075.14 |
| 55 | $79,956.71 |
| 56 | $74,095.85 |
| 57 | $79,706.86 |
| 58 | $72,115.96 |
| 59 | $70,326.64 |
| 60 | $75,015.20 |
| 61 | $72,920.81 |
| 62 | $81,069.36 |
| 63 | $86,611.73 |
| 64 | $78,376.98 |
| 65 | $68,337.69 |
| 66 | $62,547.80 |
| 67 | $69,253.93 |
| 68 | $70,495.48 |
| 69 | $64,105.08 |
| 70 | $56,380.41 |
What is the top 1% salary by age in the United States?
Here are the summary top 1% salary benchmarks in the US in full year 2021, starting at 25 years old and moving up a decade at a time:
- Age 25: $155,000.00
- Age 35: $400,000.00
- Age 45: $400,000.00
- Age 55: $500,000.00
- Age 65: $300,000.00
Remember to be appropriately skeptical with top 1% salaries. By definition, fewer people earn up here and the distribution isn't as well behaved.
| Age | Top 1% Salary |
| 16 | $100,000.00 |
| 17 | $70,000.00 |
| 18 | $55,000.00 |
| 19 | $109,000.00 |
| 20 | $115,000.00 |
| 21 | $75,000.00 |
| 22 | $100,000.00 |
| 23 | $124,122.00 |
| 24 | $151,000.00 |
| 25 | $160,000.00 |
| 26 | $175,000.00 |
| 27 | $200,000.00 |
| 28 | $180,000.00 |
| 29 | $200,000.00 |
| 30 | $220,000.00 |
| 31 | $250,000.00 |
| 32 | $300,000.00 |
| 33 | $265,000.00 |
| 34 | $350,000.00 |
| 35 | $350,000.00 |
| 36 | $350,000.00 |
| 37 | $400,000.00 |
| 38 | $316,000.00 |
| 39 | $362,000.00 |
| 40 | $338,000.00 |
| 41 | $430,000.00 |
| 42 | $400,000.00 |
| 43 | $800,000.00 |
| 44 | $350,000.00 |
| 45 | $500,000.00 |
| 46 | $350,000.00 |
| 47 | $350,000.00 |
| 48 | $300,000.00 |
| 49 | $320,000.00 |
| 50 | $450,000.00 |
| 51 | $350,000.00 |
| 52 | $400,000.00 |
| 53 | $340,000.00 |
| 54 | $400,000.00 |
| 55 | $380,000.00 |
| 56 | $390,000.00 |
| 57 | $300,000.00 |
| 58 | $328,378.00 |
| 59 | $350,000.00 |
| 60 | $290,000.00 |
| 61 | $400,000.00 |
| 62 | $350,000.00 |
| 63 | $400,000.00 |
| 64 | $350,000.00 |
| 65 | $245,000.00 |
| 66 | $350,000.00 |
| 67 | $330,000.00 |
| 68 | $560,000.00 |
| 69 | $300,000.00 |
| 70 | $400,000.00 |
My warning in the income by age post applies here, too: to smooth over the spikes, look at a few adjacent ages to get a 'feel,' don't take one age as the correct value. (For what that's worth!)
Income vs. Salary
Salary is what you earn from a job, your wage income. Income is a much more expansive set of ways to earn money. Here, think: business, investment, interest, rent, etc.
We specialize in income here on DQYDJ – find all our recent income posts here. (Including household income and individual income).
Salary by Age Summary for the United States in 2022
Want a bit more resolution? Check out the salary percentile by age calculator for the full picture.
You can also find past years here:
Methodology on 2022 United States Salary Brackets
This data comes from the United States Census Bureau's Annual ASEC survey from September 2022.
Sarah Flood, Miriam King, Renae Rodgers, Steven Ruggles, J. Robert Warren and Michael Westberry. Integrated Public Use Microdata Series, Current Population Survey: Version 9.0 [dataset]. Minneapolis, MN: IPUMS, 2022. https://doi.org/10.18128/D030.V9.0
Here is an estimate of the number of workers in age group, along with the sample count:
| Age | Estimated Workers | Samples |
| 16 | 236,359 | 130 |
| 17 | 535,443 | 279 |
| 18 | 815,096 | 428 |
| 19 | 1,129,414 | 483 |
| 20 | 1,588,668 | 658 |
| 21 | 1,873,824 | 766 |
| 22 | 1,800,628 | 741 |
| 23 | 2,327,767 | 850 |
| 24 | 2,584,644 | 976 |
| 25 | 2,805,504 | 1,112 |
| 26 | 2,762,505 | 1,102 |
| 27 | 2,889,375 | 1,141 |
| 28 | 3,005,056 | 1,174 |
| 29 | 3,120,318 | 1,274 |
| 30 | 3,064,341 | 1,333 |
| 31 | 3,191,607 | 1,420 |
| 32 | 3,104,099 | 1,364 |
| 33 | 3,041,874 | 1,365 |
| 34 | 2,962,355 | 1,346 |
| 35 | 3,041,615 | 1,418 |
| 36 | 3,117,966 | 1,476 |
| 37 | 2,848,685 | 1,436 |
| 38 | 2,858,631 | 1,464 |
| 39 | 2,860,186 | 1,452 |
| 40 | 2,878,184 | 1,487 |
| 41 | 3,046,893 | 1,517 |
| 42 | 2,919,473 | 1,449 |
| 43 | 2,883,600 | 1,435 |
| 44 | 2,577,402 | 1,339 |
| 45 | 2,769,544 | 1,356 |
| 46 | 2,533,118 | 1,261 |
| 47 | 2,635,206 | 1,252 |
| 48 | 2,551,107 | 1,238 |
| 49 | 2,499,441 | 1,184 |
| 50 | 2,732,798 | 1,225 |
| 51 | 3,018,127 | 1,343 |
| 52 | 2,573,028 | 1,200 |
| 53 | 2,532,141 | 1,146 |
| 54 | 2,299,383 | 1,017 |
| 55 | 2,331,551 | 1,025 |
| 56 | 2,603,346 | 1,148 |
| 57 | 2,445,736 | 1,030 |
| 58 | 2,497,219 | 1,077 |
| 59 | 2,312,262 | 987 |
| 60 | 2,279,876 | 959 |
| 61 | 2,174,337 | 907 |
| 62 | 1,987,103 | 816 |
| 63 | 1,767,499 | 761 |
| 64 | 1,492,951 | 656 |
| 65 | 1,324,430 | 556 |
| 66 | 907,874 | 405 |
| 67 | 774,025 | 348 |
| 68 | 651,755 | 279 |
| 69 | 603,535 | 265 |
| 70 | 440,449 | 205 |
What is your screen?
You can find the worker screen in the salary research post's methodol
