
The JOLTS report dropped today, right on the heels of the employment report last week. That makes this as good of a time as any to take a look at the job market.
As a reminder, one of our favorite measure of job market strength (on the employee side) is the ratio of Quits to Total Separations. It tougher economic times, the number of Total Separations won't move much, but the number of Quits will decrease. In essence, workers are more willing to test the waters and voluntarily leave work if the job market is "good" (for whatever that means).
Quits to Separations in July 2017
Topline, the JOLTS release reported 5,259,000 total non-farm job separations and 3,221,000 non-farm 'quits', or voluntary separations. That ratio - 61.25% - has been over the psychologically important 60% threshold since June of last year. Before that, you'd have to return to September, 2008 to even get a number in the 50%s.
Further, in all the data we have on JOLTS, 60% was only breached before in February, 2001 and July, 2006. So, at least in our current job market ecosystem - the last 12 months have shown job seekers to be historically confident.
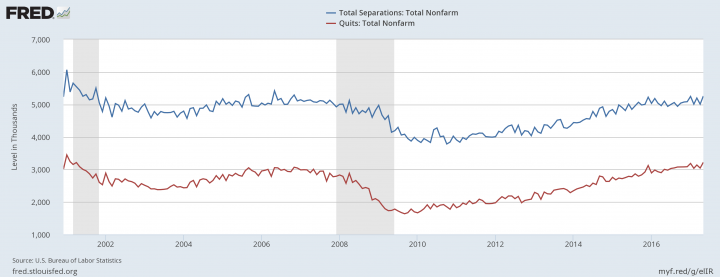
Quits vs. Total Separtions through 05/2017
Quits and Separations History
Here's how that ratio has shaken out since the peak of the business cycle before the Great Recession.
| Date | Quits / Total Separations | Total Separations | Quits |
| 08/06 | 60.05% | 5,001,000 | 3,003,000 |
| 09/06 | 58.72% | 5,007,000 | 2,940,000 |
| 10/06 | 56.68% | 5,171,000 | 2,931,000 |
| 11/06 | 58.00% | 5,291,000 | 3,069,000 |
| 12/06 | 59.63% | 5,108,000 | 3,046,000 |
| 01/07 | 58.09% | 5,144,000 | 2,988,000 |
| 02/07 | 58.76% | 5,094,000 | 2,993,000 |
| 03/07 | 58.34% | 5,123,000 | 2,989,000 |
| 04/07 | 56.46% | 5,138,000 | 2,901,000 |
| 05/07 | 59.21% | 5,080,000 | 3,008,000 |
| 06/07 | 56.09% | 5,065,000 | 2,841,000 |
| 07/07 | 57.58% | 5,118,000 | 2,947,000 |
| 08/07 | 57.79% | 5,105,000 | 2,950,000 |
| 09/07 | 52.53% | 5,031,000 | 2,643,000 |
| 10/07 | 56.23% | 5,129,000 | 2,884,000 |
| 11/07 | 55.20% | 5,031,000 | 2,777,000 |
| 12/07 | 56.68% | 4,926,000 | 2,792,000 |
| 01/08 | 56.56% | 5,005,000 | 2,831,000 |
| 02/08 | 55.67% | 5,010,000 | 2,789,000 |
| 03/08 | 54.07% | 4,762,000 | 2,575,000 |
| 04/08 | 56.28% | 5,121,000 | 2,882,000 |
| 05/08 | 55.03% | 4,728,000 | 2,602,000 |
| 06/08 | 54.33% | 4,900,000 | 2,662,000 |
| 07/08 | 54.11% | 4,713,000 | 2,550,000 |
| 08/08 | 50.18% | 4,815,000 | 2,416,000 |
| 09/08 | 51.48% | 4,751,000 | 2,446,000 |
| 10/08 | 49.27% | 4,895,000 | 2,412,000 |
| 11/08 | 44.80% | 4,605,000 | 2,063,000 |
| 12/08 | 43.71% | 4,814,000 | 2,104,000 |
| 01/09 | 41.07% | 4,974,000 | 2,043,000 |
| 02/09 | 40.78% | 4,674,000 | 1,906,000 |
| 03/09 | 39.55% | 4,536,000 | 1,794,000 |
| 04/09 | 37.25% | 4,655,000 | 1,734,000 |
| 05/09 | 41.97% | 4,146,000 | 1,740,000 |
| 06/09 | 42.51% | 4,192,000 | 1,782,000 |
| 07/09 | 40.17% | 4,297,000 | 1,726,000 |
| 08/09 | 41.28% | 4,060,000 | 1,676,000 |
| 09/09 | 40.13% | 4,084,000 | 1,639,000 |
| 10/09 | 42.29% | 3,951,000 | 1,671,000 |
| 11/09 | 46.06% | 3,873,000 | 1,784,000 |
| 12/09 | 42.54% | 3,989,000 | 1,697,000 |
| 01/10 | 42.84% | 3,894,000 | 1,668,000 |
| 02/10 | 45.01% | 3,830,000 | 1,724,000 |
| 03/10 | 45.40% | 3,949,000 | 1,793,000 |
| 04/10 | 49.18% | 3,892,000 | 1,914,000 |
| 05/10 | 46.72% | 3,831,000 | 1,790,000 |
| 06/10 | 45.94% | 4,223,000 | 1,940,000 |
| 07/10 | 43.20% | 4,278,000 | 1,848,000 |
| 08/10 | 47.49% | 4,009,000 | 1,904,000 |
| 09/10 | 47.71% | 4,026,000 | 1,921,000 |
| 10/10 | 48.94% | 3,784,000 | 1,852,000 |
| 11/10 | 46.27% | 3,843,000 | 1,778,000 |
| 12/10 | 48.11% | 4,026,000 | 1,937,000 |
| 01/11 | 46.70% | 3,908,000 | 1,825,000 |
| 02/11 | 48.78% | 3,838,000 | 1,872,000 |
| 03/11 | 49.42% | 3,980,000 | 1,967,000 |
| 04/11 | 49.06% | 3,924,000 | 1,925,000 |
| 05/11 | 50.48% | 4,035,000 | 2,037,000 |
| 06/11 | 47.61% | 4,094,000 | 1,949,000 |
| 07/11 | 48.53% | 4,082,000 | 1,981,000 |
| 08/11 | 50.66% | 4,120,000 | 2,087,000 |
| 09/11 | 49.72% | 4,115,000 | 2,046,000 |
| 10/11 | 48.69% | 4,011,000 | 1,953,000 |
| 11/11 | 48.71% | 4,001,000 | 1,949,000 |
| 12/11 | 48.95% | 3,994,000 | 1,955,000 |
| 01/12 | 49.30% | 4,010,000 | 1,977,000 |
| 02/12 | 49.82% | 4,175,000 | 2,080,000 |
| 03/12 | 52.35% | 4,134,000 | 2,164,000 |
| 04/12 | 49.39% | 4,260,000 | 2,104,000 |
| 05/12 | 50.42% | 4,336,000 | 2,186,000 |
| 06/12 | 50.06% | 4,367,000 | 2,186,000 |
| 07/12 | 50.82% | 4,138,000 | 2,103,000 |
| 08/12 | 49.84% | 4,360,000 | 2,173,000 |
| 09/12 | 48.71% | 4,059,000 | 1,977,000 |
| 10/12 | 48.81% | 4,194,000 | 2,047,000 |
| 11/12 | 49.60% | 4,171,000 | 2,069,000 |
| 12/12 | 51.71% | 4,038,000 | 2,088,000 |
| 01/13 | 53.46% | 4,297,000 | 2,297,000 |
| 02/13 | 54.14% | 4,156,000 | 2,250,000 |
| 03/13 | 50.64% | 4,113,000 | 2,083,000 |
| 04/13 | 52.72% | 4,376,000 | 2,307,000 |
| 05/13 | 51.64% | 4,363,000 | 2,253,000 |
| 06/13 | 52.61% | 4,267,000 | 2,245,000 |
| 07/13 | 53.92% | 4,384,000 | 2,364,000 |
| 08/13 | 52.80% | 4,517,000 | 2,385,000 |
| 09/13 | 52.99% | 4,537,000 | 2,404,000 |
| 10/13 | 56.32% | 4,288,000 | 2,415,000 |
| 11/13 | 55.58% | 4,268,000 | 2,372,000 |
| 12/13 | 52.76% | 4,335,000 | 2,287,000 |
| 01/14 | 52.85% | 4,443,000 | 2,348,000 |
| 02/14 | 54.17% | 4,436,000 | 2,403,000 |
| 03/14 | 54.60% | 4,452,000 | 2,431,000 |
| 04/14 | 54.47% | 4,518,000 | 2,461,000 |
| 05/14 | 55.14% | 4,565,000 | 2,517,000 |
| 06/14 | 54.39% | 4,552,000 | 2,476,000 |
| 07/14 | 53.93% | 4,784,000 | 2,580,000 |
| 08/14 | 54.85% | 4,627,000 | 2,538,000 |
| 09/14 | 57.31% | 4,882,000 | 2,798,000 |
| 10/14 | 56.30% | 4,927,000 | 2,774,000 |
| 11/14 | 56.83% | 4,633,000 | 2,633,000 |
| 12/14 | 55.00% | 4,789,000 | 2,634,000 |
| 01/15 | 56.97% | 4,843,000 | 2,759,000 |
| 02/15 | 57.00% | 4,705,000 | 2,682,000 |
| 03/15 | 54.87% | 4,986,000 | 2,736,000 |
| 04/15 | 55.40% | 4,906,000 | 2,718,000 |
| 05/15 | 57.15% | 4,812,000 | 2,750,000 |
| 06/15 | 55.66% | 5,011,000 | 2,789,000 |
| 07/15 | 57.27% | 4,849,000 | 2,777,000 |
| 08/15 | 57.79% | 4,958,000 | 2,865,000 |
| 09/15 | 55.14% | 5,067,000 | 2,794,000 |
| 10/15 | 56.89% | 4,983,000 | 2,835,000 |
| 11/15 | 58.42% | 5,003,000 | 2,923,000 |
| 12/15 | 59.77% | 5,223,000 | 3,122,000 |
| 01/16 | 57.50% | 5,033,000 | 2,894,000 |
| 02/16 | 57.57% | 5,183,000 | 2,984,000 |
| 03/16 | 58.17% | 5,040,000 | 2,932,000 |
| 04/16 | 58.48% | 4,962,000 | 2,902,000 |
| 05/16 | 58.91% | 5,101,000 | 3,005,000 |
| 06/16 | 60.32% | 4,940,000 | 2,980,000 |
| 07/16 | 60.61% | 5,001,000 | 3,031,000 |
| 08/16 | 60.25% | 5,059,000 | 3,048,000 |
| 09/16 | 62.24% | 4,942,000 | 3,076,000 |
| 10/16 | 61.06% | 5,041,000 | 3,078,000 |
| 11/16 | 60.69% | 5,075,000 | 3,080,000 |
| 12/16 | 60.68% | 5,084,000 | 3,085,000 |
| 01/17 | 60.72% | 5,247,000 | 3,186,000 |
| 02/17 | 60.62% | 5,008,000 | 3,036,000 |
| 03/17 | 60.37% | 5,198,000 | 3,138,000 |
| 04/17 | 60.78% | 5,008,000 | 3,044,000 |
| 05/17 | 61.25% | 5,259,000 | 3,221,000 |
A Leading Indicator?
It's interesting to note that Quits and Separations were a leading indicator in the last cycle. Quits fell off a cliff while separations fell ~20% or so in total, but both fell before the official recession.
NBER, which (retroactively) dates recessions put the start of the Great Recession in December, 2007. At that point you were already seeing 10% fewer Quits on an ongoing basis.
While the fall was subtle - and slightly noisy - in retrospect, the ratio was a good indicator. While the unemployment rate steals the headlines (and was little changed at 4.4%), JOLTS gives an interesting glance below the surface. We'd suggest you keep an eye on it - but the job market continues to be very strong in the meantime.
