
On this page is an ETF return calculator and CEF return calculator which automatically computes total return including reinvested dividends. Enter a starting amount and time-frame to estimate the growth of an investment in an Exchange Traded Fund or Closed End Fund, or use the tool as an index fund calculator. Additionally, simulate periodic investments into a fund by year, month, week, or day.
Next, try the ETF Drawdown Calculator to see past drawdowns in an ETF investment. Or, try the ETF Daily Moving Average calculator to compare two trendlines, or the ETF correlation calculator for a comparison of daily fund returns.
How To Use the ETF Total Return Calculator
To begin, you need to enter at least an ETF's ticker. As you type, it will auto-complete active exchange traded fund tickers.
Basic Exchange Traded Fund Details and Inputs
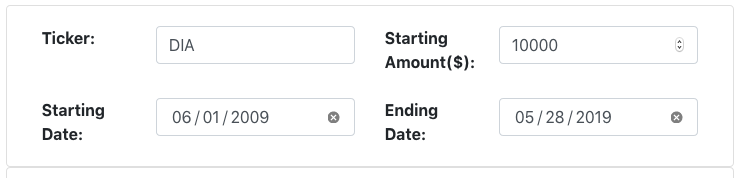
- Ticker: Enter a valid, active ETF ticker [ZIP] from Tiingo (or CEF ticker). If someone else has ever searched it before, you can also search by the ETF name.
- Starting Amount ($): In dollars, an initial investment amount
- Starting Date: Enter when an investment was first made °
- Ending Date: Enter when an investment was sold °
° Depending on the ETF data (see more below), we might adjust the starting date and ending date. Check under the tool after your calculation.
Advanced Dividend and Periodic Investment Options
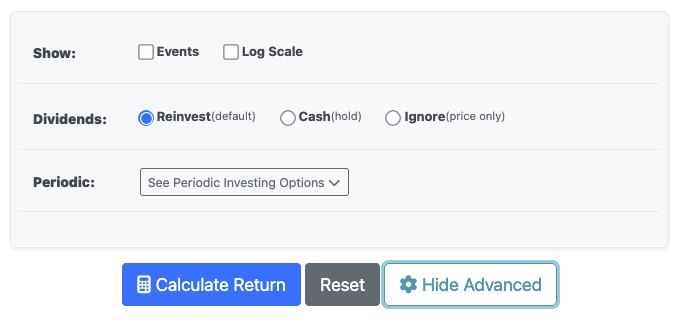
Click Show Advanced to open the advanced ETF dividend and investment panel. You'll get a screen like the above.
Display Options
- Events: Check the box to display dividend and stock split event in Tiingo's database. (If you enable periodic investments, those will also appear as events. More below.)
- Log Scale: Display the chart using a logarithmic scale, useful for viewing long-term growth patterns.
Dividend Treatment Options
Choose how dividends are handled in your investment scenario:
- Reinvest (default): Automatically purchases additional shares with dividend payments, simulating a Dividend Reinvestment Plan, or DRIP. This is a total return calculation.
- Cash: Hold all dividend payments as cash without reinvesting. The final results will show the value of shares owned and cash dividends received. This option reveals an additional breakdown showing Shares Value and Cash Dividends in the results.
- Ignore: Calculates returns based on stock price appreciation only.
The dividend treatment method you select is indicated below the chart after you run the tool, and the other outputs will also adjust.
Periodic Investments
Simulate dollar-cost averaging or investing over time:
- Enable Periodic Investments: Activate regular investment simulation
- Frequency: Choose how often to model a periodic investment: Daily, Weekly, Monthly, or Annually
- Amount: The dollar amount to invest per period
When periodic investments are enabled, each investment appears as an event on the chart (if events are displayed). The tool calculates returns including the effects of dollar-cost averaging – XIRR.
Interpreting ETF Model Results
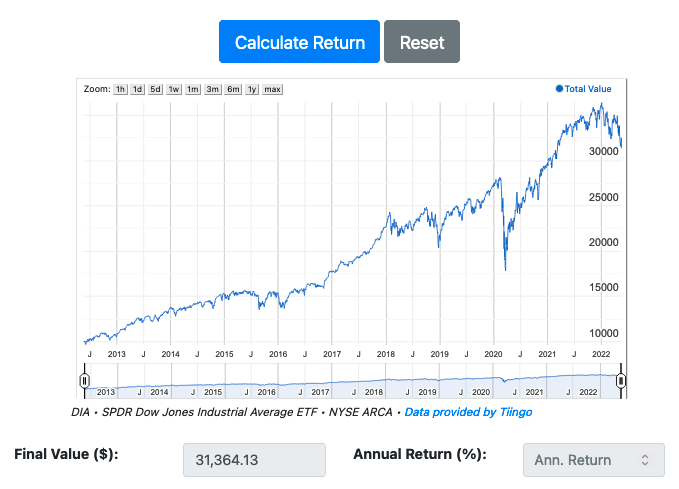
- Final Value ($): The value of the ETF or CEF investment on the 'Ending Date'. Again, note we may change that date depending on the database limits/trading days. The total date range will be under the chart, and you can hover over days.
- Annual Return: Our estimate of the annualized percentage return by the investment, including periodic investments. The final value will show the actual ending balance if you want to compute a total return. (See our compound annual growth calculator) It is adjusted for the advanced dividend treatment options, too, if you choose to use them.
- Graph: The value of the ETF investment over time. If you're on desktop, hover over a point to see the investment value snapshot on any day in your scenario.
Modeling Dollar Cost Averaging
Using the tool and periodic investments, you can also model dollar cost averaging. Dollar cost averaging is my preferred normal style of investing, where you invest on a regular basis.
For periodic windfalls you receive, I prefer investing the lump sum all at once. Though if it's better for you, psychologically, to meter it out, that's still a good option.
Source and Methodology of the Exchange Traded Fund Total Return Calculator
The ETF return calculator is a derivative of the stock return calculator. Much of the features are the same, but (especially for smaller funds) the dividend data might be off.
The tool uses the Tiingo API for price and dividend data. Tiingo isn't free, so we have some very modest limits in place:
- ETF and CEF data may be up to 7 trading days old. Note: weekend refreshes and market holidays might mean this is over 7 'actual' days'.
- Always check the tool ending date after a scenario to see data recency of the ETF.
- Here are the rate limits in place:
- Maximum 50 calculations per day
- Maximum 10 calculations per minute
- Limits apply across all of the Tiingo calculators
Limitations and Disclaimers
The exchange traded fund total return calculated contains idealized return data. It is based on closing and opening prices and would not match a real investor's gains exactly.
The tool is for informational purposes only. We cannot warrant any results. ETF outputs are good for initial research, but please verify any information the tool outputs independently.
Note that there are other factors the tool is ignoring:
- Taxes
- Your portfolio management fees
- Dividend timing
- Slippage
- Other things
It is very possible that the price or dividend datasets are wrong too (please report it if you find a bug).
Using the tool as an Index Fund return calculator
Many ETFs track published indexes, so the tool is very useful as a quick comparison on index funds. (Yes, we know – many more are in mutual fund form.)
For the gold standard of index fund returns – perhaps with less resolution – see the prospectus of the fund. This calculator will give you a reasonable approximation of index fund returns, but your ETF provider probably calculated them exactly.
Bug Reports, Feature Requests, and Requests to Help with the ETF Total Return Calculator
Let us know if you find a bug. Include the fund with the issue so I can debug it.
Feel free to send enhancement requests, just know that the bar is very high. Outside of ads, I'm not paid to build or maintain this tool. For significant requests, please make a contracting inquiry.
Again, this information is for informational and research purposes only. We cannot and will not be able to help in a legal capacity. We can only help you with research inquiries. For legal inquiries, this data might be a useful starting point, but you probably need a professional known as a "forensic accountant".
ETFs, CEFs, Dividends, and Total Returns
We've maintained some version of a stock return calculator for some time now. After a mutual fund return calculator, an ETF return tool has been one of our most popular requests.
As we like to stress on this site, dividend adjusted returns are the most important returns. Unless you are shoveling your dividend checks into your fireplace (or shredder), dividends are real money which you can use to reinvest. Those additional shares also lead to real money. Dividends make up a huge amount of return when you trace them back over a long enough timeframe.
This tool, in many ways, is better than some of our popular index total return calculators. ETFs (and mutual funds) are the most common ways to track an index, although they include fees and slow down dividend timing. However, they are the most common way to track an index... making them more accurate for individual investors.
If you'd like to compare:
- Dow Jones Industrial Average Calculator
- S&P 500 Calculator
- Wilshire 5000 Calculator
- ETF or Mutual Fund Fee Calculator
Adjust Your CEF and ETF Returns for Total Returns
ETFs are relatively new when compared to common stocks and mutual funds. Still – at least for ETFs that pay dividends – we often see returns quoted out of context. When you buy VTI or DIA, don't only look at the price return on your fund. Be sure to factor in any additional shares you buy from the dividends you receive.
(Or, at least, know that you're spending the dividends.)
We hope you enjoyed the CEF and ETF total return calculator. Use it in good health, and tell your friends!
