
Today I'm going to walk you through my workflow where I import fixed width data into R, manipulate it, and export it for usage on this site. The end result of this walkthrough is a CSV file which you should be able to import into your favorite spreadsheet program. Here you go, if you want to skip to the good stuff:
It has four sheets, which I will explain briefly. I compiled some data on average incomes by year and split up by age. I also have the 'overall' averages by year, and weights for ages per year so you can play with the composition of the workforce and determine how it affects statistics like average income.
Incomes are of people who were in the workforce in the previous year:
- Age_Year_Avg_Income: Average income of full-time and part-time workers (see definition), split by age and year
- Average_Income_Year: Average income by year, same definition
- Age Weights: Total Workforce Weight and Weight by Age by Year (to allow normalization/comparison)
- Annual CPI Deflator: Year is release year, but the CPS survey is March of the previous year and the income data is the 12 months of the preceding year. That sheet shows what to use as inflation, normalized to 1999 (see more).
How Can You Get Import Width Files Into R and Export to a Spreadsheet Program?
I wanted to write something up briefly because I saw some interest on Twitter on converting fixed width files (one of the most popular ways to release large data sets, such as CPS survey data) into a more accessible format. Since OpenOffice and Excel allow thousands of columns at this point (and tons of rows), a lot of data manipulation can be done in spreadsheets and outside of stats programs, like R/STATA/SAS/SPSS/Matlab/Whatever. Oh, download R. (As for why we picked this data, just stick around after the walkthrough.)
- Find Some Fixed Width Data
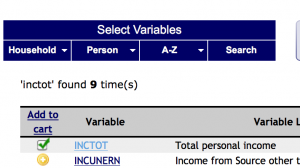
This is the easy part, actually - it's like shopping on Amazon. Lots of data sourced from Government surveys is released in this fixed file format. For this walkthrough, register an account with the University of Minnesota's Minnesota Population Center. They have anonymized CPS survey data and an amazing format to access it.Next (well, after logging in), search through variables and add the following: AGE, EDUC, CLASSWLY, UHRSWORK, FULLPART, INCTOT, INCWAGE - Pick Your Samples
The beauty of sites like IPUMS-CPS is that the definitions are persistent across years. So, age in 1962 is directly comparable to age in, say, 2011. For this walkthrough, I took everything they have, 1962 - 2015. Click on the cart and inside 'Add more samples'. Select all ASEC data from 1962-2015 - Extract a Fixed Width File
This varies on many sites, but for IPUMS-CPS, you generally will have your file in 20 minutes (they email the address you registered your account with when you signed up when it is ready). Download it - it is something like 600 MB or so. - Import Fixed Width Data into R!
Open R; we're going to do the work to get metadata on top of our fixed width data. At the same time, navigate in IPUMS-CPS to 'Codebook'->'Basic'. That book explains all of the columns we got by default and by choice, and, most importantly, the width of our columns.

Now I will walk you through importing the data, splitting it, and assigning columns. You type these commands (changing the obvious parts) into R, and hit return to continue. If it has a '#' in front, it is a comment, you do not need to type it.If you download the same variables and samples as me, widths will match (otherwise change them in the order listed in the cookbook):
incdata <- read.fwf("PATHTOYOURFIXEDWIDTHFILE", widths = c(4,5,10,1,1,2,2,10,2,3,2,2,1,8,7))
# (That step will take a while. It's 600 MB and it's headed into your RAM)
# (Finally!) Assign column names
colnames(incdata) <- c("YEAR","SERIAL","HWTSUPP","ASECFLAG","HFLAG","MONTH","PERNUM","WTSUPP","AGE","EDUC","CLASSWLY","UHRSWORK","FULLPART","INCTOT","INCWAGE")
# Make it so only 100 cells print when we print a variable - optional
options(max.print=100)
# Optional - sanity check to see it loaded
incdata
Filter/Narrow Your Data
R is a stats package. Sure, you can do these things, maybe, in Excel - but R is built for these operations. Let's filter our data set to make it more manageable for Excel/Open Office/Google Docs/Lotus 1-2-3 or whatever you use.
length(incdatafilter$YEAR)
# Shows how many rows we have to start: ~8.5 Million or soincdatafilter <- subset(incdata,incdata$AGE>17)
# Let's only get adultsincdatafilter <- subset(incdatafilter,incdatafilter$INCTOT < 99999998)
# Data is topcoded, so we throw out invalid numbersincdatafiltermarch <-subset(incdatafilter,incdatafilter$HFLAG != 0)
# Only get data from March, since there were two surveys in 2014
# (Note, sometimes this info is hard to find - just poke around if things look 'off' and you'll get a feel for these surveys)# Ready?
length(incdatafiltermarch$YEAR)
# Down to only ~4.1 Million
Do Some Statistics Work
This page explains how the survey works - it's worth a read, but you'll find we want to weight using WTSUPP. You will need the HMisc package in R to do this work - I am on a Mac this time (I use a desktop PC too, but it has less RAM), but the procedure is similar no matter what - find the 'Package Installer' and search HMisc and figure out how to install it. I then go to the 'Package Manager' and load HMisc - that lets us do the next steps:
#Make two groups of frames - one with the higher resolution of age and years and one with the lower resolution of just years
incdatayear <- split(incdatafiltermarch,incdatafiltermarch$YEAR)incdatayearage <- split(incdatafiltermarch,list(incdatafiltermarch$YEAR,incdatafiltermarch$AGE))# Add up all the weights (see lapply documentation - it runs our sum command on each group)
# as.numeric forces R to assume it should do math since R is weakly typed
outputweightsyearage <- lapply(incdatayearage,function(x) sum(as.numeric(x$WTSUPP)))
outputweightsyear <- lapply(incdatayear,function(x) sum(as.numeric(x$WTSUPP)))# Find weighted averages for every age/year or year group. Use wtd.mean
outputfileageyear <- lapply(incdatayearage,function(x) wtd.mean(x$INCTOT,as.numeric(x$WTSUPP)))
outputfileyear <- lapply(incdatayear,function(x) wtd.mean(x$INCTOT,as.numeric(x$WTSUPP)))
Export to CSV
I encourage you to read some R books or just tackle some projects - but here is where you can export to something you know if today you're more comfortable in a spreadsheet. We will write to CSV files, which any spreadsheet application of modern vintage can open. Note that if the CSV file is too long and won't import to your spreadsheet you should try the workaround I list!
write.csv(outputweightsyearage, file = "PICKAPATH/outputweightsyearage.csv") write.csv(outputweightsyear, file = "PICKAPATH/outputweightsyear.csv") write.csv(outputfileageyear, file = "PICKAPATH/outputfileageyear.csv") write.csv(outputfileyear, file = "PICKAPATH/outputfileyear.csv")# WORKAROUND: The age/year ones will have too many columns for your spreadsheet program, most likely. Here is what I do: read it into R, transpose it, export it again
x<-read.csv("PICKAPATH/outputfileageyear.csv",header = TRUE)
tx <- t(x)
write.csv(tx, file = "PICKAPATH/outputfileageyear.csv")x<-read.csv("PICKAPATH/outputweightsyearage.csv",header = TRUE)
tx <- t(x)
write.csv(tx, file = "PICKAPATH/outputweightsyearage.csv")
Do Your Work and Cite Your Source
You can take it from here, but cite the University of Minnesota. This is my data source for this walkthrough:Miriam King, Steven Ruggles, J. Trent Alexander, Sarah Flood, Katie Genadek, Matthew B. Schroeder, Brandon Trampe, and Rebecca Vick. Integrated Public Use Microdata Series, Current Population Survey: Version 3.0. [Machine-readable database]. Minneapolis: University of Minnesota, 2010.
Why Did You Pick This Data?
I use R quite often to manipulate data for this site, and I needed to release some new versions of calculators (such as this one for income by age in 2013 using the 2014 IPUMS-CPS release), so I figured I'd post a brief walk-through to output something for your spreadsheet. As for the topic, we were discussing on Twitter how the makeup of the workforce - the relative weights of the workforce by age and experience - would weigh on income statistics.
We've covered this topic (here's just one of a series of articles), and would note that the increasing number of Millennials and decreasing number of Boomers in the workforce matters when you aggregate data on things like income - which is driven by experience and rarity of skills (generally age is a pretty good proxy for that, wouldn't you say?).
What Else Can You Do With R And/Or Data From IPUMS-CPS?
You'll probably want to learn a programming language if you want to move past charts - Javascript is great for the web, and Python is what I'd recommend to anyone into big data who doesn't yet know how to code (yeah, you should learn something though).
My background is C & C++, and my day job is... well, it isn't this - but I like it enough that I spend lots of nights on this site - poke around and decide if my path is right for you, and feel free to ask!
Here is some of the work I have done on the site that required R and/or Javascript - the Python work usually is in the background before I put it on the site.
- Rewrite the tax code and reform entitlements in one post (NIT/Guaranteed Basic Income)
- Show that working more hours leads to more income
- Do work on ages versus incomes, like we're preparing here
Hope this helped you learn to import fixed width data into R: let us know your experience!
