
This is a series we revisit pretty often because... well, it's so interesting. As we've pointed out in the past, you can get pretty-much-realtime estimates about the market's inflation expectations by subtracting the yield on inflation adjusted instruments from the yields on treasuries. That, of course, leaves you with 'expected CPI', which is one of the US's primary measures of inflation (and, undoubtedly, the most quoted).
Breaking Even on Treasuries
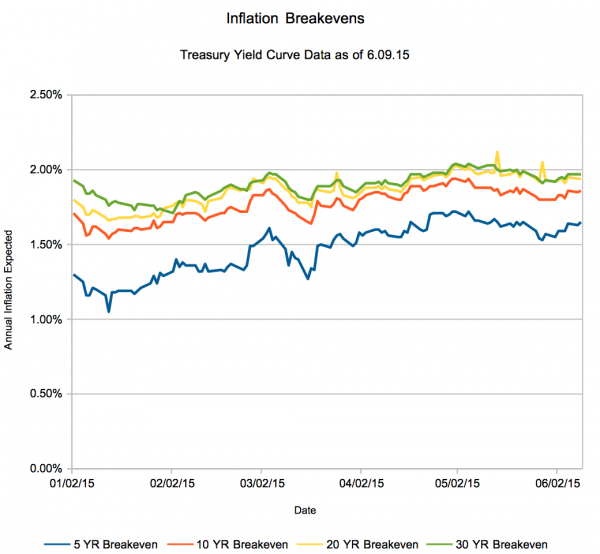
So, for this piece let's zoom out for a second and look at what these so-called "Breakevens" (because breaking even would mean the CPI estimate was spot-on) have done since the beginning of the year, along with how the Treasury Yield curve, in general, has shaped up. First up, the 'Breakeven' rate. The way to read this is:
The number shown is the annual inflation expected by the market over the stated duration. So, if the 30 year is "2%", then the market is expecting 2% CPI for the next 30 years.
And now, the Treasury yield curve. This would be interpolated (and, as the case may be, extrapolated) data based on currently selling Treasuries in the market, and put together by the US Treasury Department. Note that this is the series causing all of the sturm und drang in the bond markets.
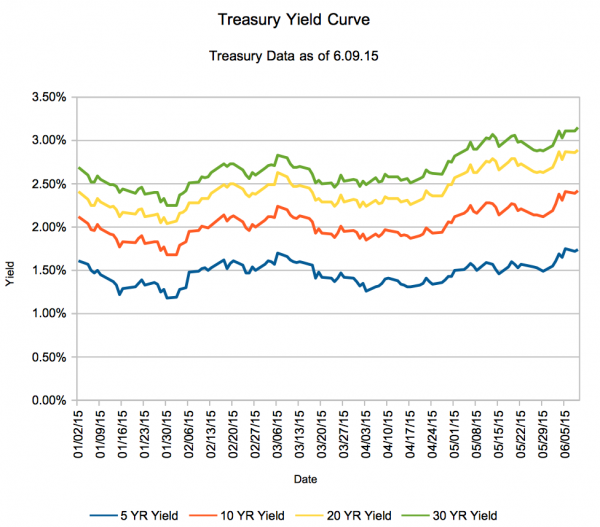
And you can see why - remember that yields and prices move in different directions. That means people who have held since the beginning of May have seen bit of a drop in the value of their holdings (present company included). And, remember that US Debt is the benchmark - lots of other assets move in unison with Treasury debt, often with a multiplier.
Breakevens and Yields
But, yes, a lot of this is probably anticipation for future Federal Reserve moves - call it a high stakes and dollar game of chicken. But it has real consequences for the bond market - and as I'm showing you today, it hasn't affected expected inflation that much.
It's almost as if people are trusting the 2% inflation target of the Federal Reserve.
But anyway, there's the data. Do you see anything interesting?
Of course, here's our calculator which automatically does some of this inflation math. For further reading and bookmarking...
