
On this page are estimated United States retirement savings. Statistics are for households headed by adults aged 32-61 at the time of the survey (the Federal Reserve's 2025 survey, released in 2026). It's the newest United States data until roughly late 2029.
You'll see average retirement savings, median retirement savings, top 1% retirement savings, and a retirement savings percentile calculator to rank a savings amount versus the adult population.
Perhaps more relevantly, later see our retirement savings by age post. For a fuller accounting of net worth in America (including assets such as businesses and real estate equity), see our net worth research and net worth by age research.
Retirement savings benchmarks in 2026
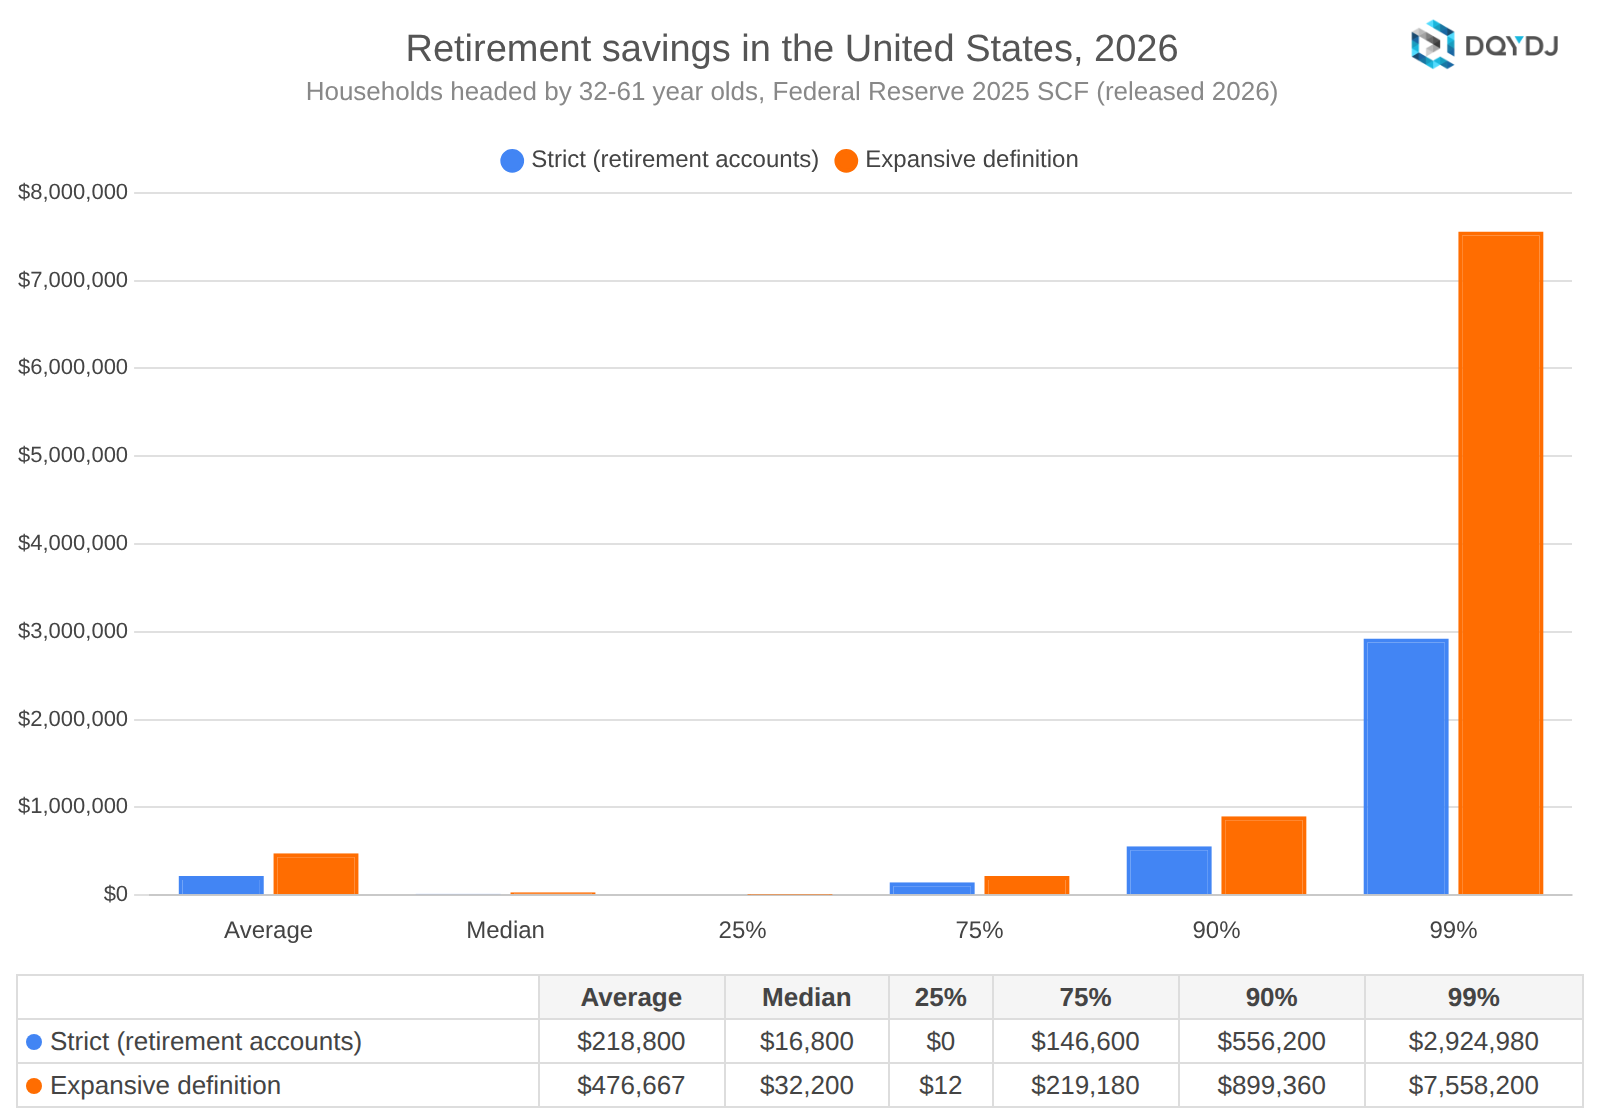
In 2026, households headed by 32 to 61 year olds had on average $218,800 saved in retirement accounts. Using an expansive definition, they averaged $476,667.
The median household had $16,800 using a strict reading of retirement savings, and $32,200 with the more expansive definition. The top 1% of households had $2,924,980 and $7,558,200 earmarked for retirement, respectively.
These numbers do not include estimates of Social Security value, the most common way people fund retirement today.
Americans with no retirement account balances
A large number of households had nothing in retirement accounts – and a small slice had a lot.
- 39.81% of households had nothing in retirement accounts
- 23.16% of households had nothing (or less) even under the expansive definition
- 5.58% of households had $1 million or more in retirement accounts (8.83% hit the threshold if you use the expansive definition)
Retirement savings percentile calculator
Want to compare an amount of retirement savings to the aggregate retirement savings for American adults? This tool has you covered.
In this tool, visualize retirement savings amounts versus other US households in 2026. Enter a retirement asset number and indicate if it's just strict retirement accounts or includes other assets. Then, hit calculate, and the tool will show you where it compares.
Retirement savings definitions and methodology
Our data comes from the Federal Reserve's 2025 Survey of Consumer Finances, released in October 2026.
For this series, we define American adults as 32-61 years old. The average age at retirement in the United States is just shy of 60, with the median and mode a little higher. This is an excellent measure of 'adults' who mostly aren't retiring yet, and this group is also mostly no longer in training or education. The 32-61 range comes from the fine work done on retirement at the Economic Policy Institute – it isn't a universal standard, and the Fed's own reports cut ages differently, so compare carefully. That's 2,373 survey families, representing about 68.2 million households.
Neither measure capitalizes traditional defined benefit pensions or Social Security. There's no cash value to count, and the Fed leaves them out for the same reason. Plans that look like pensions but report an account balance (cash-balance plans, for example) are included. See the net worth post for more.
The SCF stores a household which responded to the survey – technically, a PEU, or Primary Economic Unit – five times. I compute each statistic on all five and average them – see the full methodology discussion for how that compares to other approaches.
Strict retirement savings
For the strict definition of retirement savings, I use the Fed's RETQLIQ variable. This includes IRAs, Keoghs, and account-type employer plans – such as 401(k), 403(b), 457, thrift, SEP/SIMPLE accounts, and cash-balance plans with an account balance – from current and past jobs. IRAs and Keoghs cover everyone in the PEU; employer plans cover the reference person and spouse or partner.
Balances are counted before any loans against the plans (the SCF records those as debt). As with other posts, I don't attempt to adjust for taxes owed on pre-tax money.
Of course, those strict retirement accounts aren't the only places people save for retirement. With that in mind, I also run the numbers for a more expansive definition of retirement savings.
Expansive retirement savings
For the expansive definition, I start with the Fed's variable FIN, or all financial assets. Then remove:
- Checking accounts and prepaid cards
- Cash value life insurance
- Other financial assets – loans owed to the household, royalties, future proceeds from things like lawsuits and estates, and the like
- 529, Coverdell, and health savings account balances (unfortunately, the public set doesn't allow me to keep HSAs – more in a moment)
That leaves us savings and money market accounts, CDs, brokerage cash, mutual funds, directly held stocks and bonds, savings bonds, annuities, retirement accounts, and managed investment accounts.
What changed this edition
After reading the codebook closely – and having a spirited discussion with a few LLMs! – I tightened the expansive definition this year. Here are the changes I made versus what you may recall from past editions (I have back-populated some of the previous editions so you can see how it'd change things there).
- 529s and HSAs are not included. Unfortunately, the public data doesn't split these account types – and college savings aren't retirement savings. While many folks do save for retirement and have HSAs as part of their plan, this year I removed the whole group. To wit: counting these accounts moves the expansive median from $32,200 to $32,303, and the average from $476,667 to $484,881.
- Managed investment accounts are included; legal trusts aren't. The survey flags legal trusts and managed investment accounts separately but asks for one combined cash-in value. I count it when the family reports a managed account (including families with both managed accounts/trust, since I can't split them using the public set) and drop it for trust-only families – like 529s, trusts are mostly an estate planning tool. Before you scoff, note that trust assets already reported elsewhere, like stocks held in a trust, stay where they were reported. Trusts the family can't cash in aren't counted here.
And it's funny – I did sweat the 529/Coverdell/HSA call, but you can make the case that a number of the accounts we do count are used for spending or emergency money, not earmarked for retirement. And further, in the public SCF data, cryptocurrency is recorded as a nonfinancial asset, so it isn't included in my data here.
I don't present this methodology to argue that people can't, for example, have a miniature figurine collection or crypto wallet to fund their retirement. My goal is not to cover every corner case of retirement savings – the aggregate numbers will be close enough for the post to be useful.
If you disagree with the categories, run your numbers yourself – the Fed publishes the full public data and the code behind every summary variable.
For past versions of this post, see here:
