

One way to evaluate retirement savings is to look at a retirement savings to income multiple. In this post we'll look at a good multiple to target and how Americans are doing.
How do you compute a retirement savings to income multiple?
Take a household's total retirement savings and divide by typical household income to compute the multiple.
Like BMI and health, the retirement savings to income multiple is a good summary statistic for retirement preparedness..
What Retirement Savings to Income Multiple Should You Have by Age?
Fidelity released a Viewpoint editorial which attempted to make some recommendations. For age 30, 35, 40, 45, 50, 55, 60, and 67 they came up with a target multiple for retirement savings:
| Your Age | Fidelity Recommended Retirement Savings to Income Multiple |
| 30 | 1x |
| 35 | 2x |
| 40 | 3x |
| 45 | 4x |
| 50 | 6x |
| 55 | 7x |
| 60 | 8x |
| 67 | 10x |
Essentially:
- You should have one time your typical salary stashed away by age 30
- You should have ten times your typical salary by age 67
Calculating your own retirement savings to income multiple? Importantly, the multiple is based on savings that you solely earmark for your own retirement. Money you save for one-off spending – donations to charity, or college spending, for example – shouldn't be included.
(Fidelity notes there are a number of caveats that either lower or increase the targets. See their tool for more.)
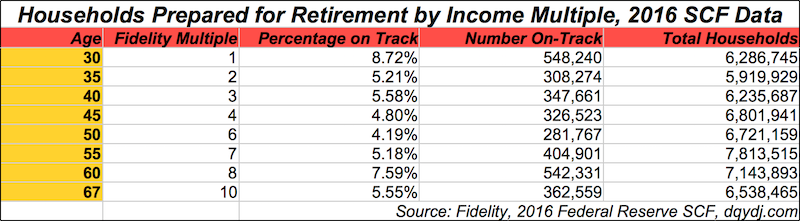
How Many Households Hit Target Retirement Savings to Income Multiples?
We were curious as to the number of households in the United States which currently match the Fidelity benchmarks.
Using 2016 SCF data with our home-built measure of retirement savings (that we call 'expansive') we found that households currently hitting the benchmarks are rare.
Just 5.21% of 35 year old householders have 2x income saved in retirement accounts. 60-year old householders were most prepared – but there only 7.59% had 8x their typical income saved.
We use a more expansive definition of retirement savings than most sites. Notably, we include:
- Savings accounts
- Taxable brokerage accounts
- Other saving vehicles.
The data doesn't include defined benefit pensions with periodic payments (such as Social Security), and we've left out real estate holdings.
Some households will downsize or otherwise tap primary home equity in retirement. Other households hold individual properties as investments and will use recurring income or capital gains from those properties in retirement.
Caveats in mind, if you'd like to expand the definition even further, we have a net worth by age calculator which includes all forms of assets.
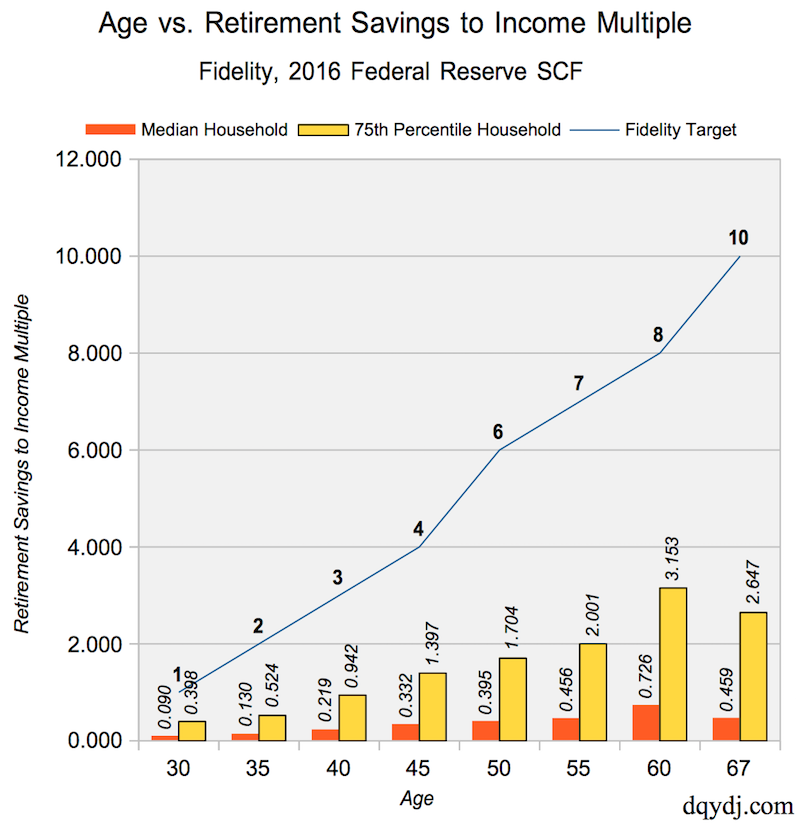
What Retirement Multiples are Households Achieving?
As we looked at in the article on retirement savings by age, most households either have retirement accounts or some other form of savings to tap in retirement. After we ran the numbers, we were curious to what multiples households in America currently achieve.
The following table lists our estimates of the multiple for median and 75th percentile households:
| Age | Fidelity Multiple | Median Household Multiple | 75th Household Multiple |
| 30 | 1 | 0.090 | 0.398 |
| 35 | 2 | 0.130 | 0.524 |
| 40 | 3 | 0.219 | 0.942 |
| 45 | 4 | 0.332 | 1.397 |
| 50 | 6 | 0.395 | 1.704 |
| 55 | 7 | 0.456 | 2.001 |
| 60 | 8 | 0.726 | 3.153 |
| 67 | 10 | 0.459 | 2.647 |
And here's the gap visually:
Are the Retirement Savings to Income Multiple Suggestions Realistic?
If you are even a casual user of Twitter (follow me here!), you know that the Fidelity multiples went viral due to their "unrealistic expectations". The 35-year old guidance of '2x salary' drew particular ire on Twitter, with a multitude of humorous responses suggesting it is wildly out of reach.
Seemingly, 35-year olds on Twitter have a shortage of retirement savings but no shortage of snark. Here's my personal favorite from the genre.

Snark aside, the numbers are very much in reach if you target them from your early career. 10% savings into >= 60% stock from age 23-35 would have covered most of today's 35 year olds.
(As an aside, a typical younger household should consider 80-100% of their allocation in risky assets.)
Sadly, that savings rate is more aspirational than descriptive for much of America... and currently mired in the low-single digits. While the US savings rate covers all households, it's more important to save while you're young because of the time value of your investments.
If you aren't yet saving 10%, you should make the sacrifices to get there. For more information, our personal finance basics article covers most of the framework.
Methodology on Retirement Savings to Income Multiples
The multiples themselves come from Fidelity, while estimates of retirement savings come from the 2016 SCF. The extensive savings estimate methodology is detailed in our post on retirement savings in America.
There are too few samples to use a single age in the numbers.
In each age group we added householders one year younger to one year older to the set. For example, '30 year old householders' includes 31 and 29 year old householders as well.
For the multiple, we used our tally of retirement savings versus the household's reported "typical annual income". Typical income is what a household expects to make in a typical year. This eliminates (some) variation due to large capital gains from house sales, business sales, and the like.
