
In the 2019 Survey of Consumer Finances, the average household reported $8,665.03 in education debt. The median household reported $0 in student loans. Only 21.4% of households reported carrying any student debt at all.
But – the SCF doesn't give us a full snapshot of the data. While very useful for seeing the household distribution of debt, the SCF is strained on the student loan front.
Let's dive in and look at student loan statistics from a few angles.
Student Loan Debt Statistics in America
Student loan debt is some of the trickiest debt to pin down. Due to survey design and sourcing, the three primary surveys in the United States disagree on how much student loan debt is out there.
Because the microdata is the richest, I'll primarily use the Federal Reserve SCF in this post. However, let's first look at aggregate student debt stats from the New York Fed and the Fed's G.19 survey.
New York Fed Household Debt and Credit Report
The New York Fed Household Debt and Credit report from Q3 2020 implies about $1.55 trillion in student loan debt outstanding.
Currently, 6.5% of that balance is considered 90+ day delinquent. Note that 6.5% is lower than it might otherwise be – student loan forbearance and interest relief enacted at the end of March 2020 provided some relief to borrowers (along with other stimulus programs).
As recently as Q4 2019, a worryingly high 10.75% of student loan debt was 90+ day delinquent.
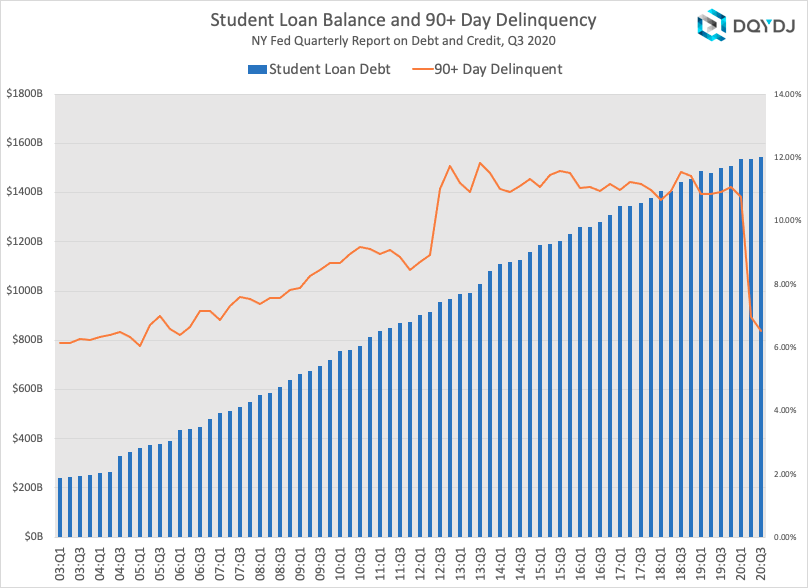
The New York Fed's data uses a random 5% sample of Equifax credit reports to compute student loan debt. It's likely pretty accurate – although it may double count student loans during transfers or similar events or miss some older loans.
Federal Reserve G.19 Student Loan Debt
In Q4 2020, the Federal Reserve's G.19 credit report implied $1.707 trillion in student loans outstanding.
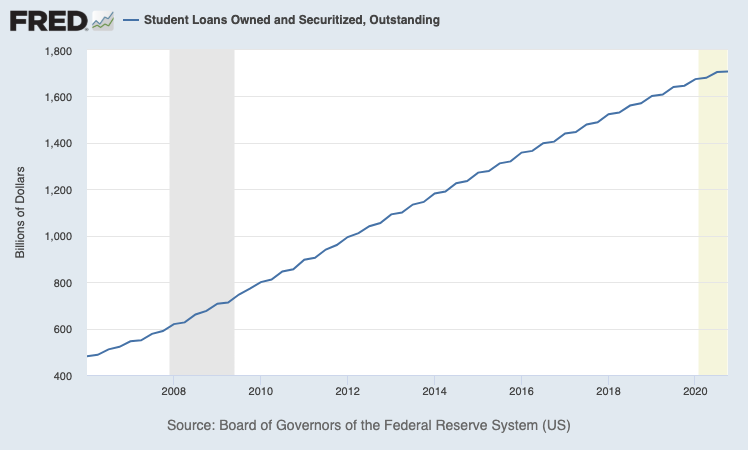
The G.19 gives us the highest estimate. It includes survey data from holders of student loan debt – banks, finance companies, and the Federal Government – and, as you can see, has the most pessimistic view of US student loan debt.
Taking the G.19 worst case student loan total, the average household holds around $13,200 in student loan debt.
The Survey of Consumer Finances
In 2019, the Survey of Consumer Finances implied around $1.115 trillion in educational debt outstanding.
As you can see, the SCF likely underestimates total student debt outstanding by roughly 30%-40%, depending on how we score the 'real' number.
From a footnote in Bricker et. al, 2015 (linked above):
The core is typically the economically dominant single person or couple in the household, plus all other people in the household that are economically interdependent with that single person or couple. In this way, a young adult who is renting a house with roommates will be included in the economic core, but her roommates likely will not be. Likewise, an adult child living at home with her parents but with otherwise independent finances will not be included in the family.
Additionally, we don't see data from dorms: "...the frame for the SCF excludes institutional residences, including college dorms."
Luckily for you and me, the three main sources all grow at around the same rate. To that end: the SCF is still useful for student loan stats, but you need to keep its blind spots in mind.
Student Loan Debt Statistics by Percentile
Again, the SCF implies that only 21.4% of households hold any student loan debt at all. Here are the student loan debt breakpoints for selected percentiles of households:
| Student Loan Debt Percentile | Student Loan Balance |
| 1-49% | $0.00 |
| 50% | $0.00 |
| 75% | $0.00 |
| 80% | $2,100.00 |
| 85% | $10,800.00 |
| 90% | $25,750.00 |
| 95% | $52,000.00 |
| 96% | $67,700.00 |
| 97% | $80,000.00 |
| 98% | $100,000.00 |
| 99% | $150,000.00 |
Example of how to read this: "2% of American households have $100,000 or more in student loan debt"
Remember, this is a snapshot of current debt with all the caveats I laid out in the aggregate section. It's not showing the whole universe of loans, nor does it show stats for households that already paid off their debt.
Age 25-40 Households and Student Loan Debt
Here is the student loan percentile chart only for households led by someone age 25 - 40:
| Student Loan Percentile | Student Loan Balance |
| 1% | $0.00 |
| 50% | $0.00 |
| 75% | $16,000.00 |
| 80% | $26,000.00 |
| 85% | $38,000.00 |
| 90% | $60,900.00 |
| 95% | $103,000.00 |
| 96% | $120,000.00 |
| 97% | $140,000.00 |
| 98% | $167,000.00 |
| 99% | $233,000.00 |
Example of how to read this: "2% of American households headed by someone age 25-40 have $167,000 or more in student loan debt"
With this age split, a whopping 40.69% of households have student loan debt.
How many households have very large student loan debt outstanding?
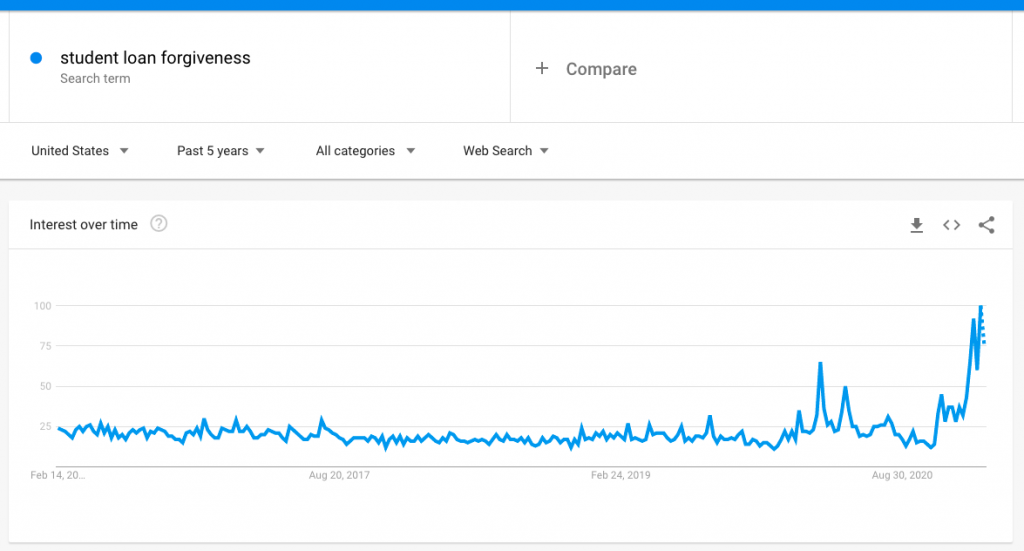
As Joe Biden was running for President, one topic that captured the popular imagination was student loan forgiveness.
So far, we've seen two main "potential" proposals:
Let's take a look at each in turn.
$10,000 or more in Student Loans
According to the SCF, around 15.6% or 20.1 million households hold $10,000 or more in student loan debt. If the government were to forgive $10,000 in debt, roughly 6.3% of households with positive student loan debt – 8.2 million – would have their complete balance paid off.
Of course, there's plenty of error here... remember, the SCF estimate is low. Additionally, we don't know precisely how forgiveness will proceed – a cap per household, perhaps?
$50,000 or more in Student Loans
According to the SCF, about 5.4% of households or 7.1 million households have $50,000 or more in student loan debt. If the government were to forgive $50,000 in household student loans, 16.1% of households – or 20.8 million households – would have a $0 balance.
Note the caveats in the $10,000 forgiveness section, they still apply.
How many households could pay off their student loans?
Another way to look at student loan debt is to see what percentage of households could – if pushed – pay off their student loans.
Around 13.9% of households – 17.8 million or so – have student debt along with a positive (or $0) net worth. About 64.9% of households with student loan debt have a $0 or higher net worth overall. Compare that number to the overall net worth statistics.
Now, that doesn't mean it's a bad choice to keep student loan debt. There are many reasons – from housing to loan forgiveness programs to 401(k)s with a match and so on – why you might not pay off a student loan.
Student Loan Debt by Generation
As you might imagine, student loan debt heavily falls on Millennials and Generation X. Nearly 43% of Millennial households have an active student loan balance – and another 26% of Generation X households:
| Generation | Average | 25th Percentile | Median | 75th Percentile | Percentage with Debt |
| Millennial | $20,135.41 | $0.00 | $0.00 | $18,000 | 42.94% |
| Generation X | $10,008.51 | $0.00 | $0.00 | $1,200.00 | 25.95% |
| Baby Boomer | $3,291.60 | $0.00 | $0.00 | $0.00 | 8.59% |
| Silent | $306.66 | $0.00 | $0.00 | $0.00 | 1.85% |
Wondering my chosen split of generations?
- Millennial (25-37 years old – note I'm dropping 18-24 due to the SCF's limitations)
- Gen X (38-54)
- Baby Boomer (55-74)
- Silent (75-94)
Student Loan Debt by Income Bracket
Student loans are not only skewed by age but also by income. In fact, student loans are biased – quite a bit – to upper incomes.
Here is the chart for the average student loan debt by household for both the entire universe of households and only those led by someone age 25-40:
| Income Percentile (%) | All Households | Age 25-40 Households |
| 0-9.9 | $3,633.61 | $9,656.34 |
| 10-19.9 | $3,285.49 | $8,245.48 |
| 20-29.9 | $6,035.88 | $11,804.46 |
| 30-39.9 | $7,401.99 | $12,059.02 |
| 40-49.9 | $9,796.45 | $20,744.43 |
| 50-59.9 | $9,814.08 | $16,905.26 |
| 60-69.9 | $11,750.67 | $28,708.72 |
| 70-79.9 | $13,999.30 | $27,615.90 |
| 80-89.9 | $13,887.24 | $27,382.43 |
| 90-94.9 | $9,727.94 | $18,273.48 |
| 95-98.9 | $4,655.90 | $11,178.10 |
| 99-100 | $3,156.78 | $62,532.52 |
Note: 25-40 year old led households use the income percentile scale from all households. You could say, for example: "Households led by someone age 25-40 in the top 1% of income had an average of $62,532.52 in student debt".
Income Bracket and Student Debt Holders
Now, let's look at the percentage of households in chosen income percentiles that hold student loan debt.
(Again, younger households are mapped to overall income percentiles.)
| Income Percentile (%) | Percentage with Student Loans | Percentage of 25-40 with Student Loans |
| 0-9.9 | 14.0% | 26.6% |
| 10-19.9 | 13.7% | 30.6% |
| 20-29.9 | 17.4% | 36.3% |
| 30-39.9 | 19.8% | 32.2% |
| 40-49.9 | 24.8% | 49.1% |
| 50-59.9 | 25.7% | 45.2% |
| 60-69.9 | 24.0% | 49.2% |
| 70-79.9 | 29.9% | 47.3% |
| 80-89.9 | 27.0% | 44.9% |
| 90-94.9 | 24.5% | 34.2% |
| 95-98.9 | 10.7% | 18.1% |
| 99-100 | 8.2% | 45.0% |
Once you grasp the chart, it's pretty enlightening. These two statements follow (and don't conflict):
- "Only 8.2% of households in the top 1% of income hold student loan debt."
- "45% of households led by a person age 25-40 in the top 1% of overall income have student loan debt."
That's... a considerable gap. You can see why forgiveness is so controversial, especially with such a high income skew and with younger folks carrying most of the burden.
Student Loan Debt in America
Once you peel back the curtain, student loan debt is a complicated topic. Yes, younger households hold student loan debt. Yes, higher-income households hold student loan debt.
But: that's how the system is designed to work.
College is marketed as a way to earn more – if that is at all true, we'd expect people with higher incomes to have more student loan debt!
The fact there are households with loans that aren't cracking the upper-income brackets is a symptom of something. If the system worked as promised, would we expect so many younger households with student loan debt in the lowest 10% of the income distribution?
But please, keep studying the topic – here are some other good reads on the current state of student debt:
