
Below are estimated United States net worth brackets by age in 2023.It's the newest data we'll have until 2026.
You'll also find the average, median, and top 1% net worth for selected age groups.
Net Worth Benchmarks by Age in 2023
Elsewhere, we looked at average household net worth.
While overall net worth is a useful benchmark, time in a career or job makes a huge difference to wealth. By adjusting net worth statistics for age groups – a decent proxy for experience and time in career – we can work around the effects of the United States's demographics.
Note: This data comes from the Federal Reserve's 2022 SCF. It is comprised of interviews mainly from 2022, with 25% conducted in 2023.
What was the median net worth by age?
In 2023, overall median household net worth was $192,084 (up from $121,411 in 2020).
| Age | Median Net Worth |
| 18-24 | $10,222 |
| 25-29 | $31,470 |
| 30-34 | $88,631 |
| 35-39 | $138,588 |
| 40-44 | $134,382 |
| 45-49 | $213,586 |
| 50-54 | $266,140 |
| 55-59 | $321,074 |
| 60-64 | $392,860 |
| 65-69 | $393,480 |
| 70-74 | $438,700 |
| 75-79 | $338,180 |
| 80+ | $327,200 |
What was the average net worth by age?
The overall average household net worth in 2023 was $1,059,470, well up from 2020's $746,821.
| Age | Average Net Worth |
| 18-24 | $112,104 |
| 25-29 | $120,183 |
| 30-34 | $258,075 |
| 35-39 | $501,295 |
| 40-44 | $590,710 |
| 45-49 | $781,936 |
| 50-54 | $1,132,497 |
| 55-59 | $1,441,987 |
| 60-64 | $1,675,294 |
| 65-69 | $1,836,884 |
| 70-74 | $1,714,085 |
| 75-79 | $1,629,275 |
| 80+ | $1,611,984 |
What is the top 1% household net worth by age?
Warning: please be skeptical; read this chart as "the top 1% is around this amount". A longer discussion is below.
To be top 1% in 2023, a household needed a net worth of $13,666,778. $11,099,166 was the 1% threshold in 2020.
| Age | Top 1% Net Worth |
| 18-24 | $653,224 |
| 25-29 | $2,121,910 |
| 30-34 | $2,636,882 |
| 35-39 | $4,741,320 |
| 40-44 | $7,835,420 |
| 45-49 | $8,701,500 |
| 50-54 | $13,231,940 |
| 55-59 | $15,371,684 |
| 60-64 | $17,869,960 |
| 65-69 | $22,102,660 |
| 70-74 | $18,761,580 |
| 75-79 | $19,868,894 |
| 80+ | $16,229,800 |
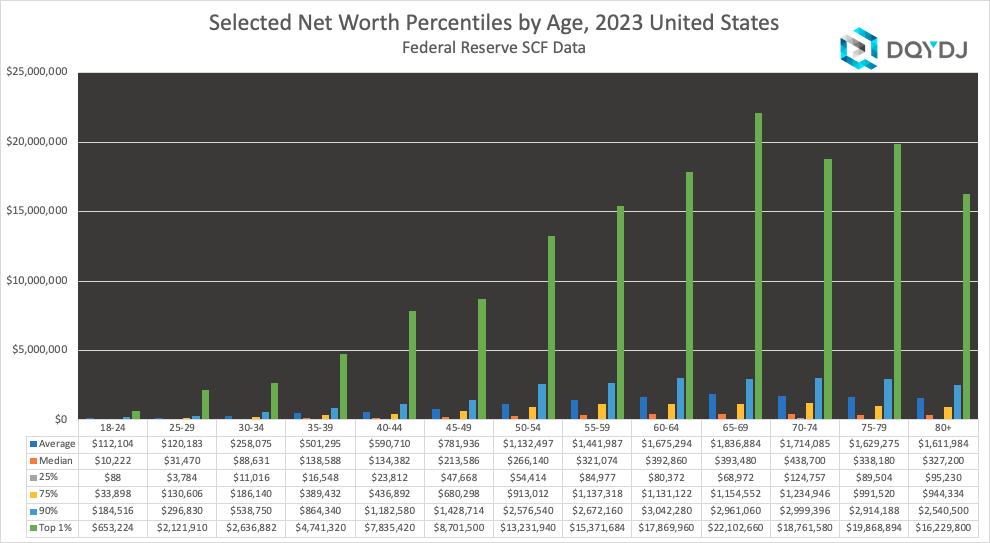
Household Net Worth Percentiles by Age for the United States in 2023
Below is every household net worth percentile in 2020 for selected percentiles and age groups. It's dense, I know – there is a more convenient presentation (with every percentile!) in the net worth by age calculator.
Net Worth By Age Brackets
Here are the net worth brackets by age in 2023 including the value of a primary residence.
| Age | Average | Median | 25% | 75% | 90% | Top 1% |
| 18-24 | $112,104 | $10,222 | $88 | $33,898 | $184,516 | $653,224 |
| 25-29 | $120,183 | $31,470 | $3,784 | $130,606 | $296,830 | $2,121,910 |
| 30-34 | $258,075 | $88,631 | $11,016 | $186,140 | $538,750 | $2,636,882 |
| 35-39 | $501,295 | $138,588 | $16,548 | $389,432 | $864,340 | $4,741,320 |
| 40-44 | $590,710 | $134,382 | $23,812 | $436,892 | $1,182,580 | $7,835,420 |
| 45-49 | $781,936 | $213,586 | $47,668 | $680,298 | $1,428,714 | $8,701,500 |
| 50-54 | $1,132,497 | $266,140 | $54,414 | $913,012 | $2,576,540 | $13,231,940 |
| 55-59 | $1,441,987 | $321,074 | $84,977 | $1,137,318 | $2,672,160 | $15,371,684 |
| 60-64 | $1,675,294 | $392,860 | $80,372 | $1,131,122 | $3,042,280 | $17,869,960 |
| 65-69 | $1,836,884 | $393,480 | $68,972 | $1,154,552 | $2,961,060 | $22,102,660 |
| 70-74 | $1,714,085 | $438,700 | $124,757 | $1,234,946 | $2,999,396 | $18,761,580 |
| 75-79 | $1,629,275 | $338,180 | $89,504 | $991,520 | $2,914,188 | $19,868,894 |
| 80+ | $1,611,984 | $327,200 | $95,230 | $944,334 | $2,540,500 | $16,229,800 |
Net Worth By Age Brackets (No House)
I know some people prefer this measure, so here are the net worth brackets by age in 2023 ignoring the value of a primary residence:
| Age | Average | Median | 25% | 75% | 90% | Top 1% |
| 18-24 | $83,365 | $9,774 | $74 | $22,616 | $74,184 | $553,224 |
| 25-29 | $84,699 | $19,270 | $1,218 | $71,680 | $191,604 | $1,877,120 |
| 30-34 | $182,198 | $36,178 | $2,530 | $100,248 | $291,262 | $2,403,902 |
| 35-39 | $380,972 | $43,416 | $8,070 | $208,930 | $645,320 | $4,556,660 |
| 40-44 | $436,408 | $57,668 | $8,699 | $245,586 | $818,830 | $6,702,740 |
| 45-49 | $575,097 | $92,370 | $15,144 | $408,002 | $1,000,826 | $7,661,420 |
| 50-54 | $861,235 | $94,923 | $13,406 | $531,484 | $1,971,490 | $11,897,166 |
| 55-59 | $1,148,392 | $131,460 | $15,108 | $709,824 | $2,013,360 | $14,054,100 |
| 60-64 | $1,364,736 | $143,640 | $12,202 | $751,586 | $2,489,008 | $15,620,874 |
| 65-69 | $1,512,595 | $132,290 | $11,780 | $784,100 | $2,302,160 | $18,992,040 |
| 70-74 | $1,380,172 | $237,692 | $28,440 | $770,944 | $2,456,520 | $16,459,620 |
| 75-79 | $1,308,408 | $112,106 | $12,818 | $527,860 | $2,384,808 | $17,971,150 |
| 80+ | $1,284,384 | $88,049 | $17,284 | $524,526 | $1,860,666 | $15,590,600 |
Note: you should include a house in your net worth – it has real value, and at minimum offsets rent you'd be paying.
Methodology on 2023 United States Net Worth Percentile Brackets
Data is sourced from the Federal Reserve's 2022 SCF, released October 2023. Find the Federal Reserve's summary reports here, and the data descriptions here.
Is this household net worth data?
This is not technically household data but primary economic unit data.
They are very close, but:
..."the PEU consists of an economically dominant single individual or couple (married or living as partners) in a household and all other individuals in the household who are financially interdependent with that individual or couple. For example, in the case of a household composed of a married couple who own their home, a minor child, a dependent adult child, and a financially independent parent of one of the members of the couple, the PEU would be the couple and the two children. Summary information is collected at the end of the interview for all household members who are not included in the PEU. The only variables collected separately for the respondent and the spouse or partner of the respondent are those concerning employment, pension, and demographic characteristics. The great majority of the time, the PEU and the household are identical."
Federal Reserve SCF Data Codebook, 2022
How many PEU samples are in 2023 wealth data by age?
- 2023: 4,602 surveys with 7 redactions. Estimated PEUs of 131,306,390
- 2020: 5,783 surveys with 6 redactions. Estimated PEUs of 128,642,430.
Samples and Estimates by Age
Broken down by age, here are the number of data points in the set (and the number of households/PEUs they map onto):
| Age | Samples | Estimated PEUs |
| 18-24 | 111 | 5,919,125 |
| 25-29 | 211 | 7,983,895 |
| 30-34 | 291 | 12,401,730 |
| 35-39 | 352 | 10,625,525 |
| 40-44 | 411 | 11,656,460 |
| 45-49 | 396 | 9,908,830 |
| 50-54 | 424 | 11,635,075 |
| 55-59 | 490 | 11,546,170 |
| 60-64 | 536 | 12,673,860 |
| 65-69 | 492 | 11,487,525 |
| 70-74 | 374 | 9,684,020 |
| 75-79 | 256 | 7,403,470 |
| 80+ | 251 | 8,380,695 |
To head off the inevitable questions about individual ages, they don't particularly make sense with this data set. There just aren't that many data points to go around – and net worth is not a normal distribution (or well-behaved at all, really).
There are only rules of thumb here: I'd prefer to use 3 samples per percentile.
For good survey design oversampling the poorly-behaved top (like in the SCF!), we can push it a bit – and I do in 18-24, 25-29, 75-79, 80+ age groups. But, please, you need to be skeptical. Particularly of the top 2-3%, in age groups like 18-24 and 25-29.
Does net worth include the capitalized value of defined benefit plans?
It's an important question – and no, it does not. For a longer discussion please see the average net worth article.
Basically, there is no secondary market for selling a defined benefit plan. I could build some sort of an overlay into the tools, but it's not a 'real' number (although recent scholarship is pretty good).
Are the younger age groups accurate?
Yes, with caveats – read this section to the end. Remember, per the net worth research, you're looking at Primary Economic Units not households.
The SCF isn't necessarily good at capturing the debt of adult children not dependent on a parent's assets in a PEU (see this paper for more, 4.2 Liabilities). For an obvious example, the SCF's sample doesn't include adults in institutional settings... or dormitories.
So: as you read, note that the younger households you see – especially in the 18-24 year old age group – are financially independent or emancipated households.
