
If you've followed DQYDJ for a while, you know that we like to revisit some types of articles for a follow up. One series we have been working on is the so called "real cost of mortgages" - an estimate of the actual, real interest rate that a mortgage will cost over its lifetime.
Mortgages and Inflation
In essence, when a bank issues a mortgage, it has to bet that whatever interest rate it floats will cover some benchmark over the life of that mortgage. That is, if a bank is issuing a 30 year mortgage, the bank needs is estimating how much inflation and other expenses will eat up of the interest rate they choose - on top of estimating when the mortgage will be 'finished' (paid off, written off, closed in a sale, refinanced, etc.).
Historically, the most common mortgage in the United States has been the thirty year mortgage (we discussed the innovation here, if you're into the history) - but thirty year mortgage terms don't mean every mortgage is on the books for thirty years. Finding hard numbers on average mortgage length has been difficult due to the industry shakeup since 2008, but, previously, mortgages usually lasted between 7 and 13 years - usually refinances or home purchases are what bring a mortgage to a close. That, of course, may no longer be the case...
Take a glance at 30 year mortgage rates today (provided by Freddie Mac via the St. Louis Fed), mashed up with market expectations of 5 and 10 year inflation:
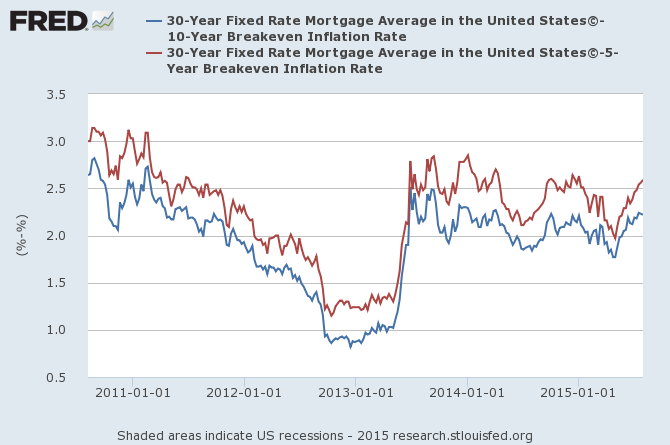
30 Year Mortgages vs. 10 and 5 Year Inflation Breakevens
What you're seeing is the spread between market inflation expectations - literally the difference between inflation protected and traditional treasuries - and the cost of a mortgage. The way to read the chart is that, over the next 5 years, a 30 year mortgage is expected to cost 2.5% more in interest than inflation - that would be the 'real' cost of a mortgage.
The Cost of a Mortgage and a House
Of course, mortgages are only one side of the equation - home prices and equivalent rental costs are the other.
However, from the perspective of borrowers, this chart speaks volumes - mortgage costs today are roughly equivalent to their costs in late 2011, and they haven't recently come close to their cheap prices centered around January of 2013. This suggests that the refinancing dynamic might change - instead of the huge reduction of interest rates (as inflation itself calmed) from the 70s until today, you might be looking at families with low priced historical mortgages, less apt to refinance or otherwise pay off the loans. Extend that further - mortgage priced might have an effect where people find it even better of a deal to stay in their homes, reducing supply and driving up cost further in desirable neighborhoods.
Or, maybe not - Japan proved (again) to Economists that interest rates can stay lower longer than anyone will predict, and even 2.5% spreads between mortgages and inflation expectations might narrow again. All of these spreads were realized in low inflation environments - if there is negative inflation at some point (ahem, deflation), it's possible to retain the same spread yet still lower rates. Of course there is also the political aspect - an increase in property taxation also changes the homeowner calculus.
So, let us know what you think - how will refinances and sales react to this inflation/mortgage spread? Will they become less popular? More popular? And, for your homework for today - mull this one over: what will happen as more Millennials finally buy homes?
