
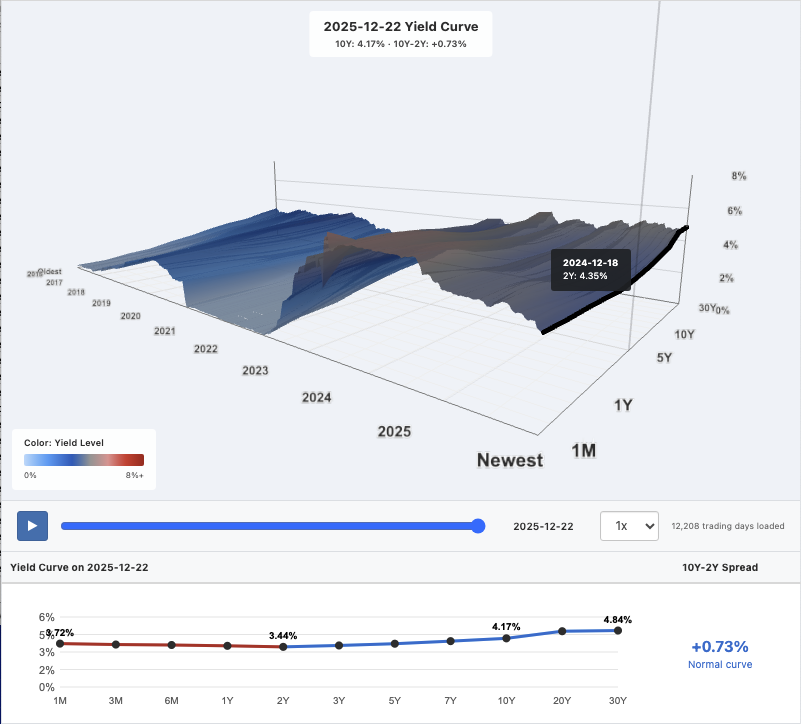
Below is an interactive 3D treasury yield curve chart showing U.S. Treasury yields from 1977 to the present. Watch rates rise, fall, and even invert over decades of economic history.
Drag to rotate, scroll to zoom. Use the timeline slider or play button to animate through history.
How to use the 3D yield curve tool
The tool loads with the last 10 years of data by default. Here's where to explore:
Basic controls
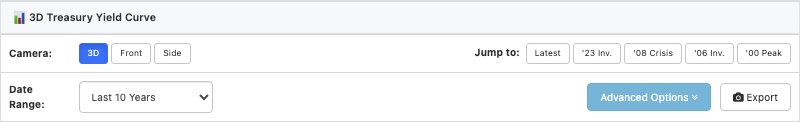
- Camera: Switch between 3D (default perspective), Front (yields over time), and Side (current curve shape) views
- Jump to: Quick presets for notable dates: Latest, '23 Inversion, '08 Crisis, '06 Inversion, and '00 Peak
- Date Range: Choose Last 2 Years, 5 Years, 10 Years, or All (~1977 to present)
- Timeline slider: Drag to scrub through time, or hit the play button to animate
- Export: Save the current view as a PNG image
On desktop, drag to rotate the 3D view and scroll to zoom. Hover over the surface to see exact yields for any date and maturity.
Advanced options
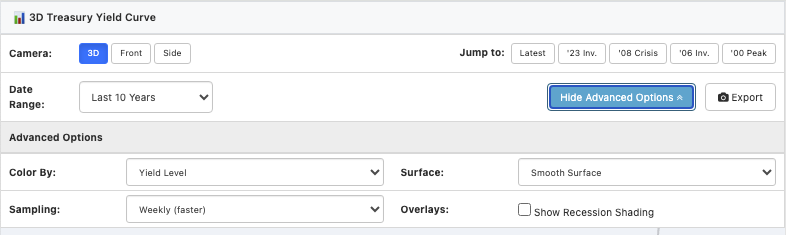
Click Advanced Options to access additional settings:
- Color By: Switch between Yield Level (blue = low, red = high) and 10Y-2Y Spread (red = inverted, blue = steep). The spread view makes inversions immediately visible.
- Surface Style: Choose Smooth, Wireframe, or Both
- Data Sampling: Weekly (faster loading) or Daily (more detail, slower)
- Recession Shading: Toggle red bands showing official NBER recession periods
Exploring the 3D view
Drag, zoom, and pan to find the best angle:
- Drag to rotate the view and see the surface from different angles
- Scroll to zoom in on specific time periods or maturities, hover for a date preview
- Right-click + drag to pan the view (two-finger drag on mobile)
- Camera presets snap you back to curated angles if you get lost
The 2D curve view
Below the 3D chart, a traditional 2D yield curve shows the current date's rates across all maturities. The 10Y-2Y spread indicator on the right shows whether the curve is normal (positive, blue) or inverted (negative, red).
What is the yield curve?
The yield curve plots interest rates on U.S. Treasury securities across different maturities, from 1-month T-bills to 30-year bonds. Normally, longer-term bonds pay higher rates (an upward-sloping yield curve) because investors demand more compensation for locking up their money longer.
When short-term rates exceed long-term rates, the curve inverts. An inverted yield curve has preceded every U.S. recession since the 1970s; the signal isn’t perfect, with a notable mid‑1960s inversion that didn’t lead to a recession. Its success predicting recessions makes it one of the most watched indicators in economics.
(And yes, an inversion predicting a recession somehow included the recession that coincided with COVID-19 going worldwide in 2020.)
This 3D visualization adds a time dimension, letting you see how the entire curve shape evolves: not just today's snapshot, but decades of shifting rates, inversions, and recoveries.
Why 10Y-2Y? (Not 10Y-3M?)
You might notice that our tool highlights the 10-year minus 2-year spread, not the 10-year minus 3-month spread or some other combination. Here's why:
The yield curve's recession-predicting power was first documented by Campbell Harvey in his 1986 dissertation at the University of Chicago (as an aside, his dissertation committee included three future Nobel laureates: Eugene Fama, Lars Hansen, and Merton Miller!). Harvey originally used the 5-year minus 90-day spread. Later, Arturo Estrella and Frederic Mishkin at the NY Fed popularized the 10Y-3M spread in their influential 1996 paper, and that's what the Fed's official recession probability model still uses today.
The Chicago Fed's research found that academics prefer 10Y-3M while practitioners prefer 10Y-2Y, and both "produce qualitatively similar results." So why show 10Y-2Y?
- The 2-year yield better reflects market expectations of where the Fed will set rates over the next couple years. That is, it's more about anticipated policy than current policy.
- The 3-month yield mostly just tracks wherever the Fed has rates right now. The Fed generally does a good job telegraphing how rates will move over the next few months – and the CME's FedWatch is a better indicator than I can host here on DQYDJ!
- The 10Y-2Y spread is what financial media typically reports, so it's more useful for following the news cycle
- Both spreads have signaled every recession since the 1970s (with occasional false positives), so the practical difference is marginal
If you want to track the Fed's preferred 10Y-3M spread, FRED has it here: T10Y3M. The Cleveland Fed also publishes a yield curve recession probability model.
Why 3D for yield curves?
3D charts have a bad reputation in data visualization (usually for good reasons – they're pretty terrible visualizations, most of the time). But yield curves are genuinely three-dimensional data: time × maturity × yield. A 2D chart can only show one dimension at a time (for example, the curve on a date... like, you know, the view under the 3D chart).
This visualization was inspired by The New York Times' 2015 piece by Amanda Cox and Gregor Aisch, which was highlighted by the Information is Beautiful Awards. As Gregor explained in a Data Stories podcast interview, the key to making 3D work is creating "a 3D chart that people can actually read" with optimal camera views and good narrative – my nod to that is the camera presets and historical jump points.
Data source and methodology
The yield data comes from the Federal Reserve Economic Data (FRED) database, updated daily. We pull all 11 constant maturity Treasury rates, and cross them with the official NBER recession indicator from FRED.
With the 3D surface, I interpolate between maturities for visual smoothness – exact yields (well, CMT yields, anyway) are shown in tooltips and the 2D chart below the 3D graph.
Related treasury and bond tools
- Treasury Return Calculator - Calculate total returns on 10-year Treasury investments
- Bond Pricing Calculator - Price bonds based on yield, coupon, and maturity
- Bond Yield to Maturity Calculator - Calculate YTM for any bond
- Bond Duration Calculator - Measure interest rate sensitivity with Macaulay and modified duration
For broader market context:
The yield curve isn't going to tell you exactly when a recession will hit. But that's not the goal – watching it evolve in 3D should give you a better feel for the economic terrain than any single shock headline trying to grab your attention. Enjoy the 3D navigation!
