
We've looked at extending our measure of the United States yield curve back in time. To recap, a yield curve inversion occurs when short-term debt yields higher than long-term debt. That is, the market judges the near-term riskier than long-term.
Since the late 1960s, this phenomenon has been a reliable indicator of a looming recession. For longer time periods... it's been little more than noise. It has been decent lately, though - it's your call on whether to promote it as a reliable indicator.
Recession Since 1871 in the United States vs. The Yield Curve
Since 1871, the National Bureau of Economic Research recognizes 29 completed business cycles - putting us in the 30th for this selected data. For all 29 recessions, we counted the number of months between a yield curve inversion. We looked at 10 year Treasuries and the difference with either our 3-6month borrowing proxy or the 2 Year Treasury. An inversion in either was counted as an 'alarm'.
The Inversion column is the number of months before the recession began that we saw one of these alarms.
| Recession Name | Duration | Length | Inversion (Months Previous) |
| Panic of 1873/Long Depression | Oct 1873 – Mar 1879 | 5 years 5 months | 17 |
| 1882–85 recession | Mar 1882 – May 1885 | 3 years 2 months | 21 |
| 1887–88 recession | Mar 1887 – April 1888 | 1 year 1 month | 9 |
| 1890–91 recession | July 1890 – May 1891 | 10 months | 14 |
| Panic of 1893 | Jan 1893 – June 1894 | 1 year 5 months | 6 |
| Panic of 1896 | Dec 1895 – June 1897 | 1 year 6 months | 2 |
| 1899–1900 recession | June 1899 – Dec 1900 | 1 year 6 months | 5 |
| 1902–04 recession | Sep 1902 –Aug 1904 | 1 year 11 months | 20 |
| Panic of 1907 | May 1907 – June 1908 | 1 year 1 month | 24 |
| Panic of 1910–1911 | Jan 1910 – Jan 1912 | 2 years | 5 |
| Recession of 1913–1914 | Jan 1913–Dec 1914 | 1 year 11 months | 7 |
| Post-World War I recession | Aug 1918 – March 1919 | 7 months | 13 |
| Depression of 1920–21 | Jan 1920 – July 1921 | 1 year 6 months | 3 |
| 1923–24 recession | May 1923 – June 1924 | 1 year 2 months | 4 |
| 1926–27 recession | Oct 1926 – Nov 1927 | 1 year 1 month | 4 |
| Great Depression | Aug 1929-Mar 1933 | 3 years 7 months | 22 |
| Recession of 1937–1938 | May 1937-June 1938 | 1 year 1 month | 90 |
| Recession of 1945 | Feb 1945-Oct 1945 | 8 months | 183 |
| Recession of 1949 | Nov 1948-Oct 1949 | 11 months | 228 |
| Recession of 1953 | July 1953-May 1954 | 10 months | 284 |
| Recession of 1958 | Aug 1957-April 1958 | 8 months | 333 |
| Recession of 1960–61 | Apr 1960-Feb 1961 | 10 months | 390 |
| Recession of 1969–70 | Dec 1969-Nov 1970 | 11 months | 3 |
| 1973–75 recession | Nov 1973-Mar 1975 | 1 year 4 months | 7 |
| 1980 recession | Jan 1980-July 1980 | 6 months | 15 |
| 1981–1982 recession | July 1981-Nov 1982 | 1 year 4 months | 10 |
| Early 1990s recession in the United States | July 1990-Mar 1991 | 8 months | 6 |
| Early 2000s recession | Mar 2001-Nov 2001 | 8 months | 9 |
| Great Recession | Dec 2007-June 2009 | 1 year 6 months | 9 |
In essence the last column was the warning indicator and the length of time before the recession actually began. Taking the Great Recession as an example, the yield curve last inverted 9 months earlier in May 2007. That month, the 10 Year Treasury averaged a yield of 4.75% while the 2 Year Treasury yielded slightly more.
(Note that we only have 2 year yields back to 1976. If that particular intermediate term borrowing series could be extended back maybe we would clean up after the Great Depression.)
Yield Curve Inversions: An Unreliable Recession Indicator
While the yield curve inversion indicator has been useful over the last 2 generations, its record before that time is... not great.
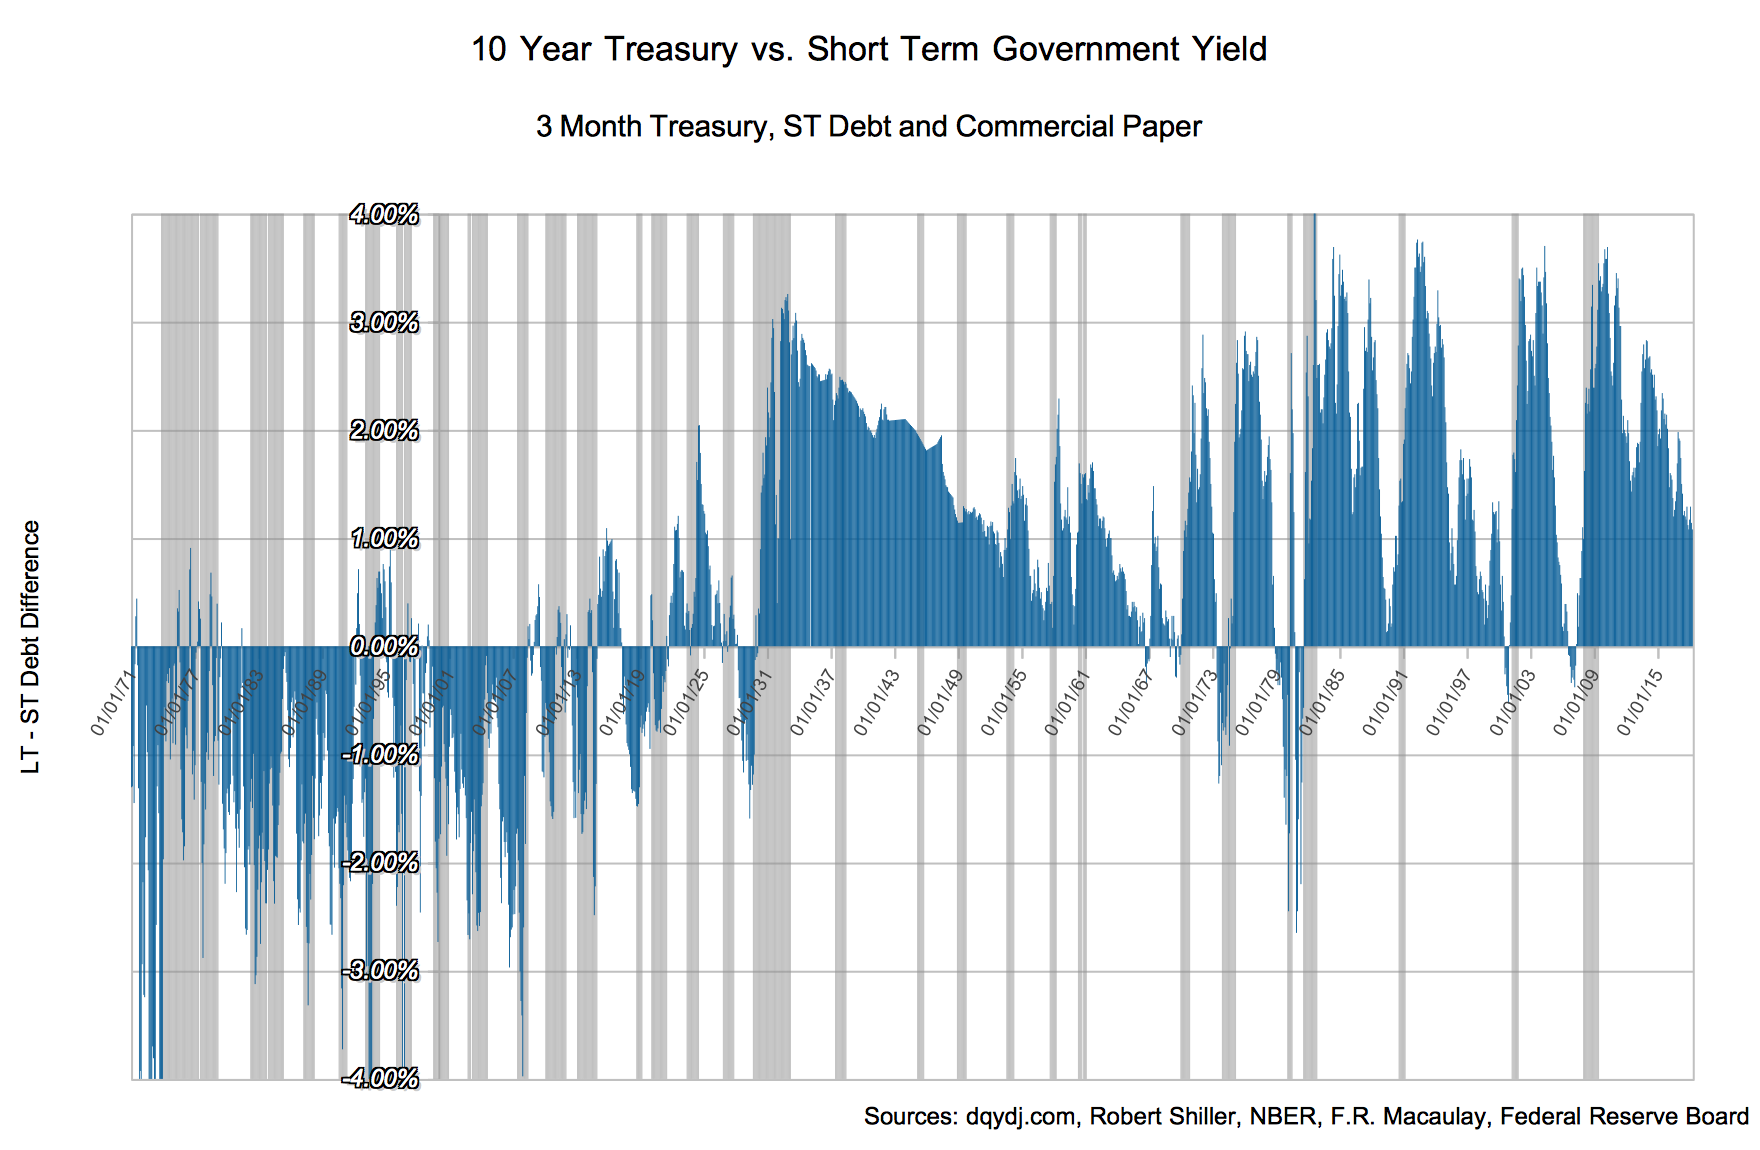
Repeating our chart from our last post, you can see even see the difference starting with the Recession of 1969 - 1970.
Before that, the Great Depression broke the indicator for an entire generation. By our indicator, the curve inverted in January 1930, righting again in March. It didn't invert again until September of 1966. Meanwhile, during that time NBER recognizes 7 recessions including the Great Depression.
Inauspicious! You'd probably be better off looking for a better indicator.
For one idea, take a spin through Jesse Livermore of Philosophical Economics's post on the unemployment rate trend versus recessions.
Methodology on the Yield Curve Versus
Our methodology on this post was generally the same as in the previous.
Inside the spreadsheet we added Robert Shiller's S&P 500 Index estimates back to 1871 (but haven't [yet] done anything with them). We also added FRED's shortcut US Treasury 10Y-2Y yield difference.
Update: For an interactive view of these inversions, see our 3D Treasury Yield Curve Chart — you can watch the curve evolve from 1990 to today and toggle recession shading to see the relationship yourself.
After that, it's all about the counting. You can find our work here:
short_term_2y_10y_interest_trend
If you use the short term rate proxy, please credit us as Don't Quit Your Day Job... (with the ellipsis). The proper credits for the rest of the series are included in the spreadsheet.
