
Unfortunately, most people aren't on track to save a significant amount of money for retirement. Depending on how you do the math, 32-61 year old households averaged around $120,809.40 in retirement savings.
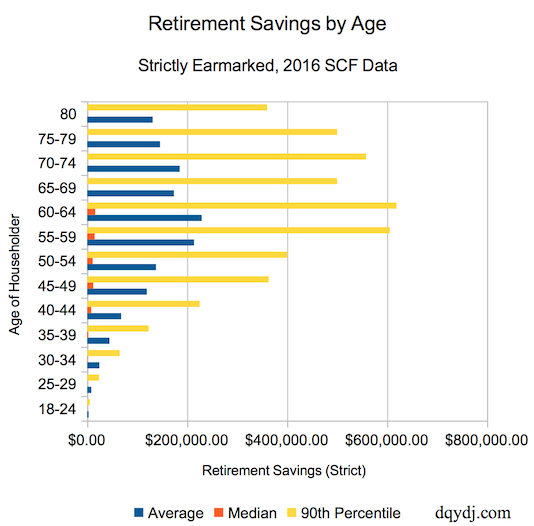
Age, of course, matters. Using a very strict definition, households headed by 30-34 year olds averaged $24,254.48 in retirement savings with a median of $700. Households in the final retirement stretch headed by a 60-64 year old averaged $229,101.05 with a median of $16,000.
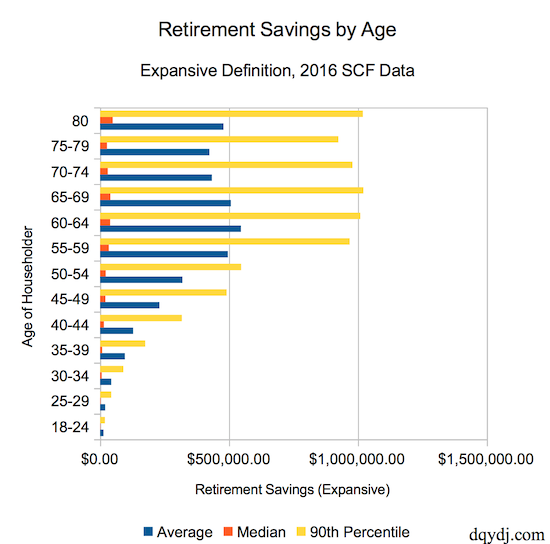
With an expansive definition allowing other liquid sources, 30-34 year old households averaged $43,162.14 with a median of $6,500. Households headed by someone aged 60-64 averaged $564,326.54 with a median of $39,000.
Retirement Savings by Age for American Households
As we discussed in our last article on American retirement savings, accounting for 'retirement savings' can be tricky.
First, we estimate savings based on a strict definition of earmarked retirement savings to approximate the Economic Policy Institute's methodology in their retirement report.
We also calculate a second expansive number which includes other liquid wealth:
- Savings accounts,
- Stocks
- Bonds
- Other investments which could be sold and spent in retirement
Strictly Earmarked Retirement Savings by Age
Strict savings are savings which are earmarked in retirement accounts or pensions. More specifically, we use the SCF macro variable RETQLIQ.
This category includes assets like IRAs, 401(k)s, 403(b)s, and company, group, or union pensions.
| Strict Retirement Savings Definition | |||
| Age Range | Average | Median | 90th Percentile |
| 18-24 | $2,963.15 | $0.00 | $5,300.00 |
| 25-29 | $8,210.14 | $0.00 | $23,700.00 |
| 30-34 | $24,254.48 | $700.00 | $65,000.00 |
| 35-39 | $44,649.91 | $2,600.00 | $123,000.00 |
| 40-44 | $67,964.71 | $8,000.00 | $225,000.00 |
| 45-49 | $119,338.11 | $12,000.00 | $363,000.00 |
| 50-54 | $137,710.41 | $11,000.00 | $400,000.00 |
| 55-59 | $213,745.91 | $15,000.00 | $605,500.00 |
| 60-64 | $229,101.05 | $16,000.00 | $619,000.00 |
| 65-69 | $173,532.84 | $0.00 | $500,000.00 |
| 70-74 | $185,104.58 | $0.00 | $558,000.00 |
| 75-79 | $145,741.92 | $0.00 | $500,000.00 |
| 80 | $131,046.32 | $0.00 | $360,000.00 |
Expansive Definition Retirement Savings by Age
Expansive savings are the above savings with additional liquid sources added on top.
(For the full definition, see our last post on retirement savings in the United States.)
| Expansive Retirement Savings | |||
| Age Range | Average | Median | 90th Percentile |
| 18-24 | $13,505.84 | $1,000.00 | $19,000.00 |
| 25-29 | $19,781.54 | $2,000.00 | $43,200.00 |
| 30-34 | $43,162.14 | $6,500.00 | $90,200.00 |
| 35-39 | $96,248.72 | $8,000.00 | $175,000.00 |
| 40-44 | $128,133.23 | $15,110.00 | $317,300.00 |
| 45-49 | $230,287.69 | $20,900.00 | $491,000.00 |
| 50-54 | $319,315.86 | $22,000.00 | $547,000.00 |
| 55-59 | $495,594.90 | $34,000.00 | $968,000.00 |
| 60-64 | $546,326.54 | $39,000.00 | $1,009,000.00 |
| 65-69 | $507,279.53 | $40,050.00 | $1,021,000.00 |
| 70-74 | $433,614.27 | $30,000.00 | $979,000.00 |
| 75-79 | $424,037.21 | $27,000.00 | $924,000.00 |
| 80 | $478,758.86 | $49,200.00 | $1,019,200.00 |
Tool: Compare Retirement Savings by Age
We created the below calculator which will let you compare retirement savings to other Americans in any age group in 2016. Choose an age of householder, retirement savings definition, and an amount and we'll estimate where it stood in 2016 with all retirement savings percentiles in the group.
It includes households which are presumably in retirement as well, all the way up to 80+ years old.
Methodology for Retirement Savings by Age
Our data comes from the 2016 Federal Reserve SCF, with their choice of variable in the case of RETQLIQ. For this particular data, it was easier to extract it from Berkeley's online SDA data extraction tool.
The rest of the methodology, including an explicit definition of expansive retirement savings are found in the original retirement savings post.
How do Your Retirement Savings Stack Up?
As we mentioned last time, we prefer the expansive definition of retirement savings to the strict one. Your retirement spending won't only be from your retirement accounts. Even still, this data doesn't capture savings for corner cases like households saving for retirement in, say, commercial real estate. If you'd like to expand the definition even further, try our net worth percentile calculator or perhaps net worth by age.
As we mentioned in the comments in the last article, this data doesn't include public pensions like Social Security. While projections show current OASDI payouts are unsustainable, zero payout is an exceedingly unlikely scenario. Reduced payouts or higher retirement ages are a more likely fix to the crunch. While it's conservative to ignore Social Security payouts in retirement planning, some amount of payouts are likely. Because of this, even households with zero savings will have some retirement income.
With the limitations, it's still compelling data... and a bit concerning. We'd like to see more households with savings and more households taking advantage of the tax savings through retirement accounts such as IRAs and 401(k)s. There are happier datapoints too; for age ranges between 30 and 64 the median household in each set had some retirement account savings.
What do you see in the data? Any interesting, concerning, or happy quirks you see with retirement savings broken out by age?
