
We present a Household Income Percentile Calculator for any age range on this page. For either Family Households or All Households, we'll estimate the income percentile breakpoints for the age of the head of household, inclusive of your choice of ages. We have data for ages 18 to 80 and 85.
For methodology and a definition of household types and a note on age rounding, see below the break. See also the (all) household income percentile calculator and the family household income calculator. As for net worth, try the net worth percentile by age calculator and the net worth bracket calculator.
Source and Methodology for the Household Income Percentile Calculator by Age
Sarah Flood, Miriam King, Steven Ruggles, and J. Robert Warren. Integrated Public Use Microdata Series, Current Population Survey: Version 4.0. [dataset]. Minneapolis: University of Minnesota, 2015. http://doi.org/10.18128/D030.V4.0.
For both Family Households (see the census definition here) and All Households, this calculator will graph the income for households headed by all ages and all age ranges. The 'householder' or 'family householder' age is the age used in the tool; for a non-family household this is the person on the lease or mortgage (see the RELATE variable for classification). Note that ages at the top end are aggregated.
Income Type by Household
We use a different type of income for the two households.
For Family Households, we use FTOTVAL. It limit the income response to just the householder's family, importantly avoiding the income for any live-in help, roommates, subletters, boarders and the like. If you are comparing to a family household, be sure to limit your own response to the same.
For All Households, we use the broadest measure, HHINCOME. Unlike the above, this includes all income in the household. If you are comparing to all households, add the incomes excluded from the above back into your input.
Other Tool Information
All of the information in the tool is pre-calculated - it might take a second to load upfront, but you can make calculations quickly. This includes any switching between the two sets to make calculations. The data adds up to ~ 2.6 megabytes.
We allow roughly one estimated percentile for every 10 samples in the survey. The tool estimates percentiles using all samples, but we're still careful of heteroscedasticity at the extremes. (And, let's be honest - that's where most of the interest lies.) You can see the report on sample size in the second text box after you run a computation.
Please let us know if you see any issues with the tool; you can get in touch here.
Why Care About Age vs. Income
As in our other popular age comparison tools such as the income percentile by age calculator and net worth by age calculator, age makes a huge difference when comparing financial resources. Age is a decent proxy for experience and older folks generally will make more until, usually, sometime in their late 40s. Advancing age also means more years for a household to accumulate wealth.
Even though the exact formulation has changed, the theme holds for households. Here's what household income looks like matched up with householder age for age 25, 35, 45, and 55:
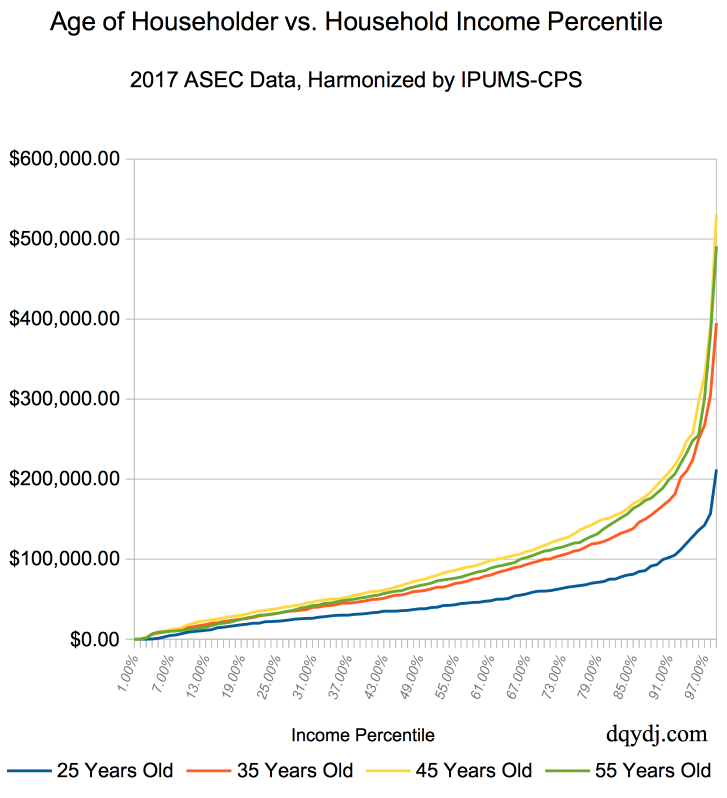
Householder Age vs. Household Income for Selected Ages
And before you ask, I redid the graph for the middle three quintiles. Here's how it looks like for a rough cut of "The Middle Class" (don't read too far into this formulation):
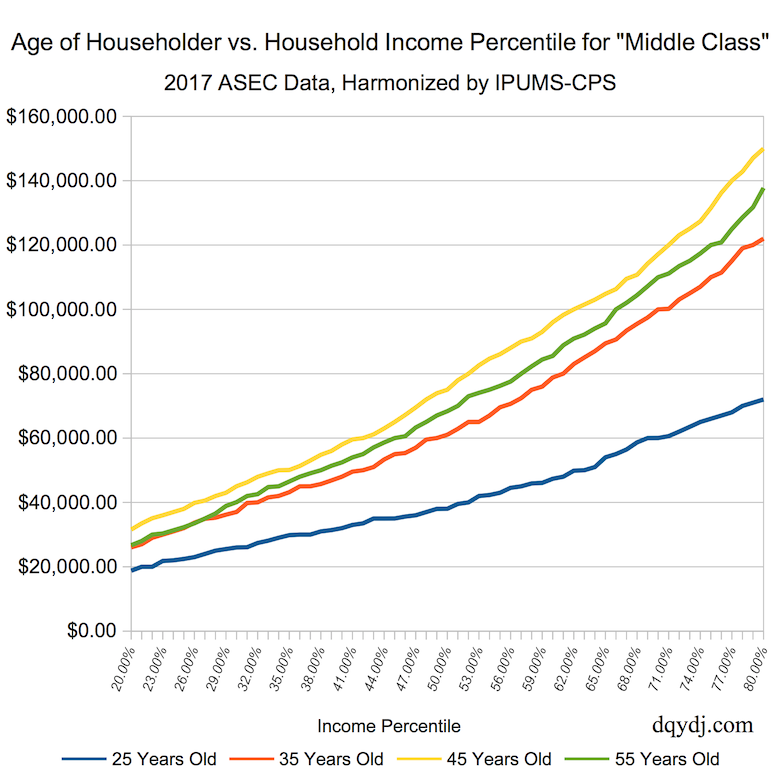
"Middle Class" Householder Age vs. Household Income for Selected Ages
The two graphs show what we telegraphed above: age makes a huge difference in income, and 'peak' earning years are probably somewhere in the 40s.
It also leads us back to a common point on DQYDJ: pay close attention to a population's composition. If the income increases for every age group but the age group mix changes, the trend can appear to move the other way. (This is known as Simpson's Paradox.) That isn't really an issue here per se, but keep the possibility in mind while evaluating statistics day to day.
Conclusions on the Household Income Percentile by Age Calculator
This is a more ambitious cut of the data than our normal fare, but we're happy with how this calculator turned out. For any age range for householders between 18 and 80 (and 85) you can quickly find the income distribution. Most satisfying, the numbers in this analysis roughly align with the numbers in other tools we've produced for the site.
If there's a conclusion to draw, it's this: age is an excellent proxy for skill and experience. Age isn't exactly that, of course, but for many analyses teasing out age gives us the distributions we'd logically expect. Further, using age (or another experience proxy) is a necessary consideration for many analyses... one which is unfortunately often ignored.
Well, just as we've continued to fight the "you need to include dividends" battle, we'll fight this one too. We hope you enjoyed the household income by age calculator - let us know what you found in the comments.
