
On this page we've estimated United States Household Income Brackets for 2018.
This data is for households in the United States, for income earned between January and December of 2017. We include a table of every household income percentile for 2018 United States data including the top one percent.
We also have research on individual incomes.
Households Income Benchmarks in 2018
We computed the date for the most interesting statistics: the median, average, and top 1% of income.
As a summary statistic, we prefer median. The median is more resistant to outliers and better represents the population.
However, we've gathered all of them for your information.
What was the median household income?
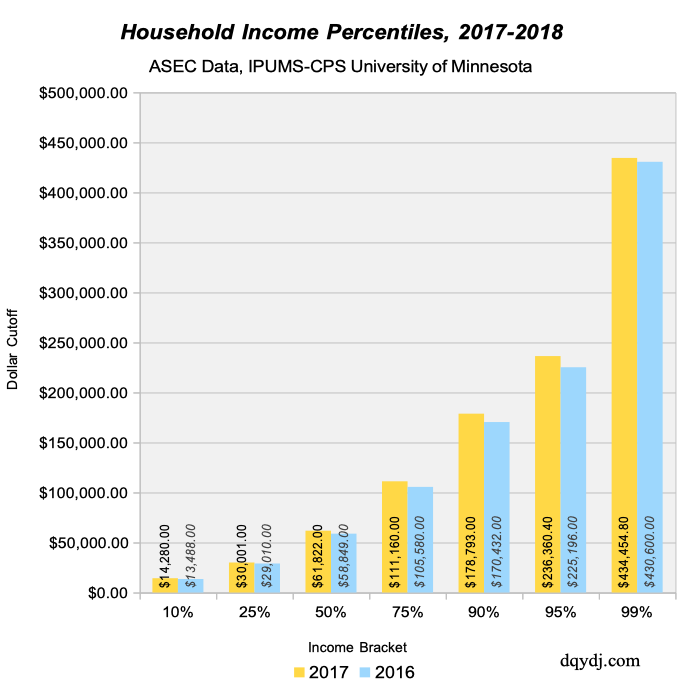
Median household income was $61,822.00 in full-year 2017.
What was the average household income?
Average household income in 2018 in the United States was $86,599.91 (Jan - Dec 2017).
What is the top 1% household income?
The threshold for a US household to be in the 1% in 2018 was $434,454.80 Jan - Dec 2017).
Selected United States Household Income Brackets for 2018 and 2017
Here we estimate breakpoints for the 10th, 25th, 50th/median, 75th, 90th, 95th, and 99th percentile of household income percentiles.
Income is defined as all income earned in the household:
- Wage income
- Business income
- Investment income
- Other income: see the list of all components
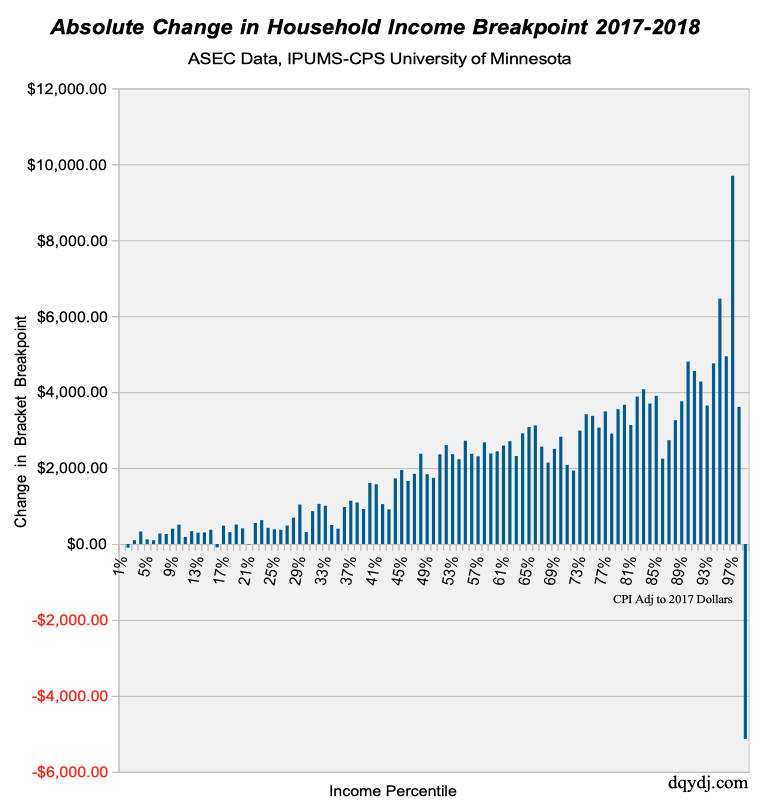
Household Income Bracket Comparisons Across Years
Full year 2017 data revealed a large broad based increase in household income for every income bracket except the 1st and 2nd percentile. For every bracket from the 3rd percentile to the 99th percentile, it took more income to be in a bracket.
However, that wasn't the case when adjusting for inflation. The 2nd, 16th, 21st, and 99th percentile income brackets all eased when adjusted for inflation:
Household Income Percentiles for the United States in 2018
Median household income was $61,822.00 in 2017, and the threshold for a US household to be in the 1% was $434,454.80. Inflation adjusted, those breakpoints were up +2.90% and down -1.17%. Average household income in 2018 in the United States was $86,599.91.
| 2017 | 2016 (CPI Adj.) | Percentage Increase | Absolute Increase | |
| 1% | $0.00 | $0.00 | 0.00% | $0.00 |
| 2% | $617.44 | $714.61 | -13.60% | -$97.17 |
| 3% | $4,050.00 | $3,946.70 | 2.62% | $103.30 |
| 4% | $7,128.64 | $6,798.00 | 4.86% | $330.64 |
| 5% | $8,820.00 | $8,698.87 | 1.39% | $121.13 |
| 6% | $9,900.00 | $9,800.39 | 1.02% | $99.61 |
| 7% | $10,800.00 | $10,522.15 | 2.64% | $277.85 |
| 8% | $12,000.00 | $11,736.99 | 2.24% | $263.01 |
| 9% | $13,067.72 | $12,663.94 | 3.19% | $403.78 |
| 10% | $14,280.00 | $13,769.55 | 3.71% | $510.45 |
| 11% | $15,049.88 | $14,863.93 | 1.25% | $185.95 |
| 12% | $16,228.88 | $15,888.88 | 2.14% | $340.00 |
| 13% | $17,246.00 | $16,946.51 | 1.77% | $299.49 |
| 14% | $18,323.12 | $18,018.43 | 1.69% | $304.69 |
| 15% | $19,619.00 | $19,242.45 | 1.96% | $376.55 |
| 16% | $20,329.28 | $20,417.48 | -0.43% | -$88.20 |
| 17% | $21,540.00 | $21,055.53 | 2.30% | $484.47 |
| 18% | $22,560.00 | $22,246.89 | 1.41% | $313.11 |
| 19% | $23,885.72 | $23,372.91 | 2.19% | $512.81 |
| 20% | $24,913.40 | $24,500.98 | 1.68% | $412.42 |
| 21% | $25,510.68 | $25,521.85 | -0.04% | -$11.17 |
| 22% | $26,735.28 | $26,182.36 | 2.11% | $552.92 |
| 23% | $28,000.00 | $27,371.67 | 2.30% | $628.33 |
| 24% | $29,012.00 | $28,584.47 | 1.50% | $427.53 |
| 25% | $30,001.00 | $29,615.55 | 1.30% | $385.45 |
| 26% | $31,000.00 | $30,626.22 | 1.22% | $373.78 |
| 27% | $32,024.16 | $31,536.84 | 1.55% | $487.32 |
| 28% | $33,363.24 | $32,667.97 | 2.13% | $695.27 |
| 29% | $34,811.00 | $33,770.51 | 3.08% | $1,040.49 |
| 30% | $35,494.60 | $35,179.32 | 0.90% | $315.28 |
| 31% | $36,800.00 | $35,934.76 | 2.41% | $865.24 |
| 32% | $38,000.00 | $36,943.39 | 2.86% | $1,056.61 |
| 33% | $39,202.92 | $38,196.00 | 2.64% | $1,006.92 |
| 34% | $40,010.00 | $39,507.82 | 1.27% | $502.18 |
| 35% | $41,240.00 | $40,834.96 | 0.99% | $405.04 |
| 36% | $42,591.24 | $41,618.99 | 2.34% | $972.25 |
| 37% | $44,020.00 | $42,879.77 | 2.66% | $1,140.23 |
| 38% | $45,100.00 | $44,006.82 | 2.48% | $1,093.18 |
| 39% | $46,525.12 | $45,603.46 | 2.02% | $921.66 |
| 40% | $48,002.00 | $46,390.56 | 3.47% | $1,611.44 |
| 41% | $49,402.00 | $47,828.97 | 3.29% | $1,573.03 |
| 42% | $50,057.36 | $49,006.04 | 2.15% | $1,051.32 |
| 43% | $51,503.76 | $50,590.43 | 1.81% | $913.33 |
| 44% | $52,976.56 | $51,247.87 | 3.37% | $1,728.69 |
| 45% | $54,533.60 | $52,585.22 | 3.71% | $1,948.38 |
| 46% | $55,765.68 | $54,106.32 | 3.07% | $1,659.36 |
| 47% | $57,472.00 | $55,622.32 | 3.33% | $1,849.68 |
| 48% | $59,100.00 | $56,719.76 | 4.20% | $2,380.24 |
| 49% | $60,055.92 | $58,218.40 | 3.16% | $1,837.52 |
| 50% | $61,822.00 | $60,077.41 | 2.90% | $1,744.59 |
| 51% | $63,618.08 | $61,256.52 | 3.86% | $2,361.56 |
| 52% | $65,016.00 | $62,411.13 | 4.17% | $2,604.87 |
| 53% | $66,615.48 | $64,249.73 | 3.68% | $2,365.75 |
| 54% | $68,180.56 | $65,948.46 | 3.38% | $2,232.10 |
| 55% | $70,002.00 | $67,281.72 | 4.04% | $2,720.28 |
| 56% | $71,501.00 | $69,124.40 | 3.44% | $2,376.60 |
| 57% | $73,296.04 | $70,985.45 | 3.26% | $2,310.59 |
| 58% | $75,012.00 | $72,334.03 | 3.70% | $2,677.97 |
| 59% | $76,594.20 | $74,209.37 | 3.21% | $2,384.83 |
| 60% | $78,567.20 | $76,126.57 | 3.21% | $2,440.63 |
| 61% | $80,049.76 | $77,455.75 | 3.35% | $2,594.01 |
| 62% | $82,000.00 | $79,292.30 | 3.41% | $2,707.70 |
| 63% | $83,942.16 | $81,622.96 | 2.84% | $2,319.20 |
| 64% | $85,606.24 | $82,692.84 | 3.52% | $2,913.40 |
| 65% | $87,941.00 | $84,857.09 | 3.63% | $3,083.91 |
| 66% | $90,000.00 | $86,876.38 | 3.60% | $3,123.62 |
| 67% | $91,740.72 | $89,174.36 | 2.88% | $2,566.36 |
| 68% | $94,024.44 | $91,878.66 | 2.34% | $2,145.78 |
| 69% | $96,285.52 | $93,777.49 | 2.67% | $2,508.03 |
| 70% | $98,823.20 | $95,996.87 | 2.94% | $2,826.33 |
| 71% | $100,324.68 | $98,237.68 | 2.12% | $2,087.00 |
| 72% | $102,894.76 | $100,961.38 | 1.91% | $1,933.38 |
| 73% | $105,505.52 | $102,518.21 | 2.91% | $2,987.31 |
| 74% | $108,600.00 | $105,180.65 | 3.25% | $3,419.35 |
| 75% | $111,160.00 | $107,783.88 | 3.13% | $3,376.12 |
| 76% | $114,375.16 | $111,308.95 | 2.75% | $3,066.21 |
| 77% | $117,320.00 | $113,827.45 | 3.07% | $3,492.55 |
| 78% | $120,207.20 | $117,298.42 | 2.48% | $2,908.78 |
| 79% | $124,029.32 | $120,477.42 | 2.95% | $3,551.90 |
| 80% | $127,144.40 | $123,478.79 | 2.97% | $3,665.61 |
| 81% | $130,541.40 | $127,408.14 | 2.46% | $3,133.26 |
| 82% | $134,947.36 | $131,061.85 | 2.96% | $3,885.51 |
| 83% | $139,138.92 | $135,061.63 | 3.02% | $4,077.29 |
| 84% | $143,418.44 | $139,719.88 | 2.65% | $3,698.56 |
| 85% | $148,412.00 | $144,509.82 | 2.70% | $3,902.18 |
| 86% | $152,341.00 | $150,091.96 | 1.50% | $2,249.04 |
| 87% | $157,871.48 | $155,136.10 | 1.76% | $2,735.38 |
| 88% | $164,340.40 | $161,078.60 | 2.02% | $3,261.80 |
| 89% | $171,081.56 | $167,321.25 | 2.25% | $3,760.31 |
| 90% | $178,793.00 | $173,989.60 | 2.76% | $4,803.40 |
| 91% | $186,949.12 | $182,389.35 | 2.50% | $4,559.77 |
| 92% | $196,285.36 | $192,005.98 | 2.23% | $4,279.38 |
| 93% | $206,209.44 | $202,561.82 | 1.80% | $3,647.62 |
| 94% | $219,223.28 | $214,465.21 | 2.22% | $4,758.07 |
| 95% | $236,360.40 | $229,896.74 | 2.81% | $6,463.66 |
| 96% | $257,324.76 | $252,379.45 | 1.96% | $4,945.31 |
| 97% | $289,303.16 | $279,603.10 | 3.47% | $9,700.06 |
| 98% | $333,360.16 | $329,747.41 | 1.10% | $3,612.75 |
| 99% | $434,454.80 | $439,588.34 | -1.17% | -$5,133.54 |
Amounts quoted are net of CPI adjustment as seen here.
Methodology for the 2018 United States Household Income Brackets
Data originated in the United States Census Bureau's Annual ASEC survey, first released in September 2018. The University of Minnesota's Minnesota Population Center harmonizes it and makes it easy for us to create extracts to bring into R.
Sarah Flood, Miriam King, Renae Rodgers, Steven Ruggles, and J. Robert Warren. Integrated Public Use Microdata Series, Current Population Survey: Version 6.0 [dataset]. Minneapolis, MN: IPUMS, 2018. https://doi.org/10.18128/D030.V6.0
- 2017: 67,909 data-points representing an estimated 127,679,100 American households.
- 2016: 69,957 data-points representing an estimated 126,519,332 American households.
Important note: the data is not longitudinal. You can not draw any conclusions about the performance of individual households from this data. Households in certain income brackets move up or down the income spectrum, but the data as presented doesn't give any history of movement.
Conclusions on Income for Households in 2018
Although we can't come to any conclusions about the performance of individual households, the data was encouraging for its broad based income gains. The only way you'd see such a large increase in (inflation adjusted) income is if there were increases across the board.
Outside of a select few income brackets – including, curiously, the top 1% of households – incomes increased across the board after inflation. That shows a general increase in buying power for many American households from full year 2016 to 2017.
How did your household income compare last year? Did you expect every household income bracket to see an increase?
