

Below is an individual income percentile calculator for the United States for 2018. Enter pre-tax income earned in full-year 2017 to compare to the US individual income distribution. (Here is the household income calculator).
After try the income percentile by state and income percentile by city calculator.
(See our math and methodology for individual income brackets in the United States.)
Individual Income Percentiles for the US Income Distribution in 2018
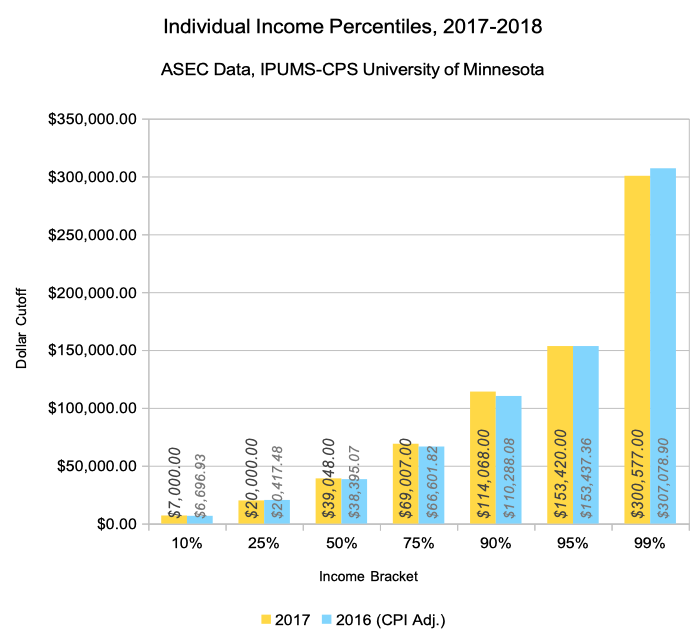
The following graph shows changes in income cutoffs for selected income brackets between 2018 and 2017 (read: full-year 2017 and 2016 earnings). The numbers shown are adjusted for inflation.
Due to your requests, we've also built in two screens based on weekly hours worked.
Since many folks have asked about full-time earnings, you can now see the results for workers who work 30+ or 40+ hours a week (inclusive) directly in this tool. Choose your favorite measure!
What was the average individual income in 2018?
In the United States, the average individual income was $55,880 in 2018. This number encompasses income earned between January and December 2017.
Again, there were significant differences for full-time workers. Those working 30 hours or more weekly averaged income of $59,356.20. Workers clocking 40 or more hours a week averaged income of $61,384.93.
What was the median individual income in 2018?
In the United States for an individual worker, the median income was $39,048 in 2018. This encompassed income earned between January and December 2017 (the survey took place in March 2018). It is up from $37,610 in full-year 2016.
Notably, there is a large difference in median income if you examine full-time workers. For those working 30+ hours weekly the median income was $41,169. For those working 40+ hours a week the median income was $43,500.
How many US workers made 6 figures in 2018?
Around 13.4% or 23,294,106 US workers made $100,000 or more in income.
How many US workers made $250,000 or more in 2018?
A mere 1.6% or 2,827,241 US workers made $250,000 or more as an individual.
What were the individual income cutoffs for top 10% and top 5% in 2018?
The top 10% of US workers made $114,068 or more while the top 5% of workers made at least $153,420.
Am I in the top one percent of income?
To reach the 1% you'd need an individual income of $300,577. The top .5% of workers made at least an income of $435,550.
What is considered a good income?
Around $43,500 is a good income in most of the United States. That is the median earnings for an individual working 40 hours per week.
Another good income goal is $100,000 per year or "six-figures". Around 13% of people made $100,000 or more in 2018.
See the income percentile by city and income percentile by state calculator for numbers adapted to your area.
What is considered middle class income?
Middle class is household income from $34,061 to $136,244 by the most common definition. This definition of middle class is half of median household income up to twice median household income.
What other calculators do you have?
Want more calculators? We're happy you're visiting!
Next, try our net worth calculator and net worth by age calculator.
For a different slice of the same dataset, try our individual income by age calculator and household income calculator.
Source and Methodology on the 2018 Individual Income Percentile Calculator
Sarah Flood, Miriam King, Renae Rodgers, Steven Ruggles, and J. Robert Warren. Integrated Public Use Microdata Series, Current Population Survey: Version 6.0 [dataset]. Minneapolis, MN: IPUMS, 2018. https://doi.org/10.18128/D030.V6.0
For methodology, please see the 2018 individual income bracket post. The only additional screens in this calculator were for workers reporting 30+ and 40+ hours a week or work, respectively.
Want to see changes over time? Try our calculators from years past:
- 2017 US Individual Income Calculator
- 2016 US Individual Income Calculator
- 2015 US Individual Income Calculator
- 2014 US Individual Income Calculator
How did your individual income rank in 2018 vs. 2017?
