
Below are estimated United States retirement savings statistics by age for 2026, from the Federal Reserve's 2025 survey (the newest data we have until roughly late 2029). You'll find the average retirement savings by age, along with median, and top 1% of savings.
For a fuller accounting of net worth as opposed to only savings for retirement, see our net worth by age research.
Retirement savings benchmarks by age in 2026
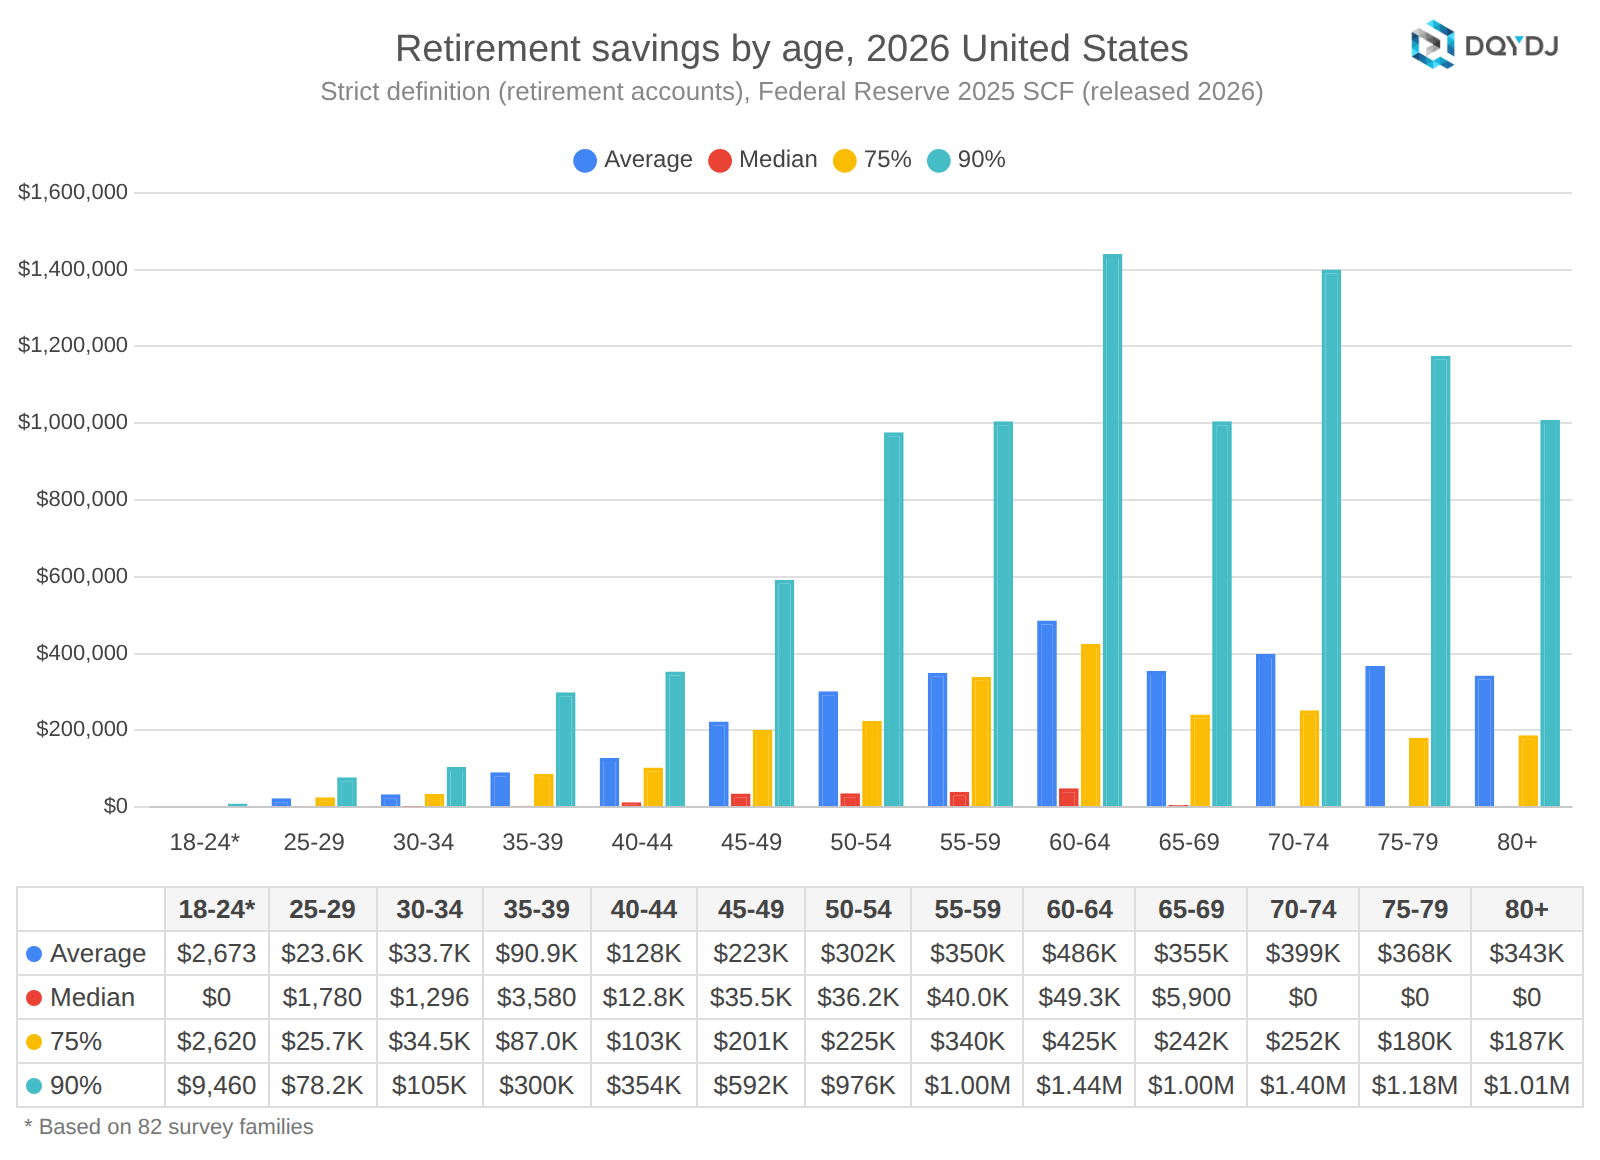
The following chart summarizes retirement savings statistics by age. First up, I'll use a strict definition of retirement savings – IRAs, Keoghs, and account-type employer plans, including pension-style plans that report an account balance.
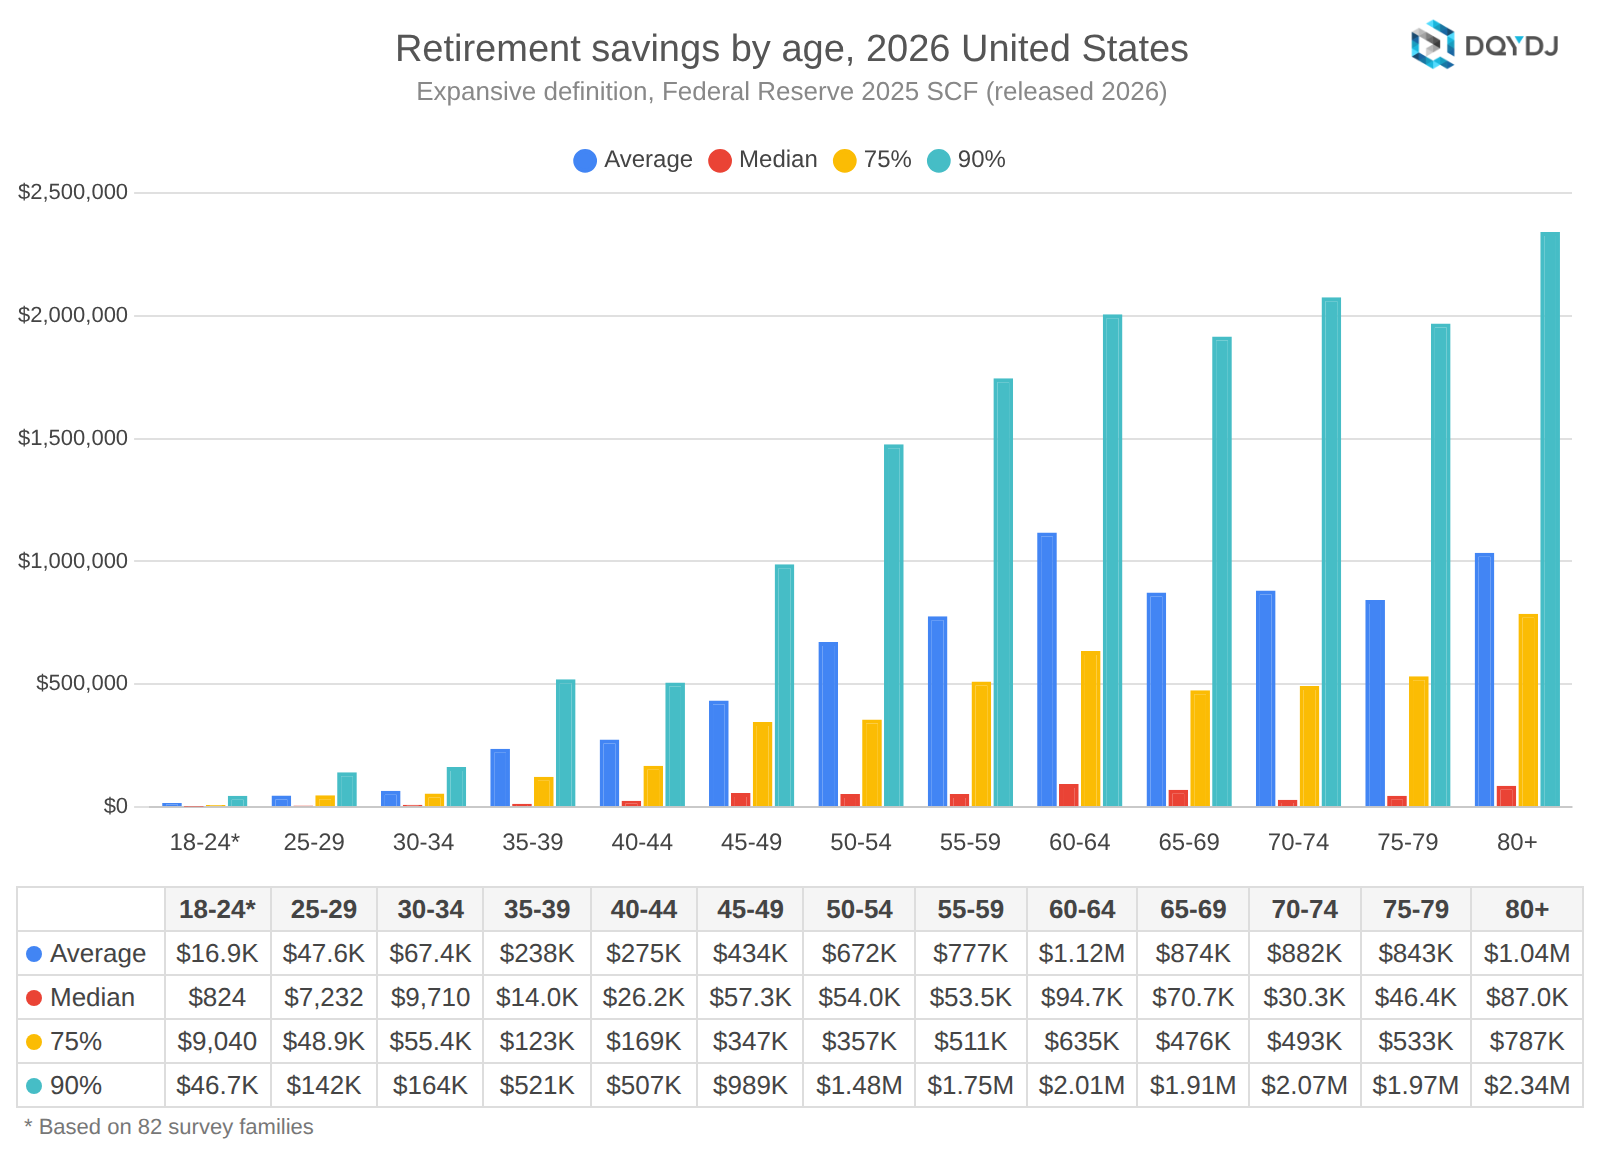
The next chart also includes summary statistics for a more expansive definition of retirement savings (defined in the methodology section).
Although we also have retirement statistics aggregated across all US adults, in many ways age is a more appropriate screen when researching retirement savings. Depending on how old you are, you'll have different amounts of accumulated savings (and, let's face it, motivation to save!).
Across Americans, the average retirement age is just shy of 60 years old (with a 62 year old median). And, yes, it makes sense for those older than retirement age to have savings. While some folks in each age bracket are still working, even retired individuals draw down their retirement over time.
Note: This data comes from the Federal Reserve's 2025 SCF, released in October 2026. See the net worth research post for details on the survey and methodology.
What are the median retirement savings by age?
In 2026, median retirement savings for households headed by 32-61 year olds was $16,800, expanding to $32,200 with the more permissive definition. Here are retirement savings medians per age:
| Age | Median Retirement Savings | Alternative Definition |
| 18-24* | $0 | $824 |
| 25-29 | $1,780 | $7,232 |
| 30-34 | $1,296 | $9,710 |
| 35-39 | $3,580 | $14,040 |
| 40-44 | $12,780 | $26,202 |
| 45-49 | $35,520 | $57,310 |
| 50-54 | $36,160 | $54,036 |
| 55-59 | $40,000 | $53,460 |
| 60-64 | $49,260 | $94,720 |
| 65-69 | $5,900 | $70,700 |
| 70-74 | $0 | $30,260 |
| 75-79 | $0 | $46,402 |
| 80+ | $0 | $87,006 |
* Based on 82 survey families
What are average retirement savings by age?
For households headed by 32-61 year olds, average retirement savings were $218,800 while a more permissive view of savings averaged $476,667. Here are the average retirement savings per age group:
| Age | Average Retirement | Alternative Definition |
| 18-24* | $2,673 | $16,888 |
| 25-29 | $23,589 | $47,646 |
| 30-34 | $33,734 | $67,442 |
| 35-39 | $90,872 | $237,978 |
| 40-44 | $128,114 | $275,104 |
| 45-49 | $223,182 | $434,292 |
| 50-54 | $301,992 | $672,339 |
| 55-59 | $350,073 | $776,859 |
| 60-64 | $485,931 | $1,117,315 |
| 65-69 | $354,834 | $874,100 |
| 70-74 | $399,272 | $881,706 |
| 75-79 | $367,847 | $843,455 |
| 80+ | $342,838 | $1,035,465 |
* Based on 82 survey families
What is the top 1% retirement savings by age?
Warning: be skeptical of top percentiles; net worth in general is ill-behaved. Consider numbers "in or around" the listed amount.
For households headed by 32-61 year olds, the top 1% retirement savings was $2,924,980 while a more expansive definition of retirement savings came in at $7,558,200 for the top 1%.
Here are the top 1% retirement savings breakdowns by age:
| Age | Top 1% Retirement Savings | Alternative Definition |
| 18-24* | N/A | N/A |
| 25-29 | $219,600 | $521,400 |
| 30-34 | $319,000 | $666,840 |
| 35-39 | $891,800 | $3,338,200 |
| 40-44 | $1,543,000 | $5,197,000 |
| 45-49 | $2,894,400 | $5,748,080 |
| 50-54 | $3,344,200 | $7,723,000 |
| 55-59 | $3,843,400 | $10,103,040 |
| 60-64 | $5,220,000 | $16,044,046 |
| 65-69 | $4,881,000 | $13,580,121 |
| 70-74 | $5,666,000 | $10,772,780 |
| 75-79 | $6,199,400 | $12,494,400 |
| 80+ | $5,058,000 | $14,848,800 |
* Based on 82 survey families
Tool: compare retirement savings by age
Looking for more data? I don't blame you – so here's every retirement savings percentile by age in 2026 in a retirement savings calculator.
Enter an age bracket, savings amount, and choose your definition of retirement savings and the tool will tell you the savings percentile.
Source for retirement savings by age
Our data comes from the 2025 Federal Reserve SCF, released in October 2026. The definitions of strict and expansive savings – including what changed this edition, and where the data is fuzzy – are in our retirement savings for adults post. Each statistic is computed on all five of the Fed's imputations and averaged.
The 18-24 group is based on just 82 survey families – definitely treat it as a rough estimate. Sample sizes for every age group are in our net worth by age post – same households, same age groups.
Past editions:
