
Every year, "conveniently" timed with tax season, we remember that DQYDJ is ostensibly a personal finance site. Let's turn tax-frowns upside down with a post on asset allocation here in in April, 2019.
Why bother? It comes back to skin in the game – a phrase recently repopularized by Nassim Taleb. In his book with the too-convenient title Skin in the Game, he lays out the reasoning perfectly:
“Don’t tell me what you think, tell me what you have in your portfolio.”
- Nassim Taleb, Skin in the Game
Positioning Our Portfolio for Safety in April 2019
Asset allocation is an interesting topic. We like to approach it with a view of all of our liquid – read: non-real-estate – assets.
In our recent post on the yield curve we mentioned our target for a 60/40 risky/safe ratio. We talked about it again in our 2018 savings rate post. We*'re anticipating choppier investment waters than the last few years.
How did we do after the self-audit? Pretty close!
| Safe Assets | 34.72% |
| Risky Assets | 65.28% |
*"we" here equals mid 30s, married, with two kids.
To be honest, it's not all that far off from our allocation last April: 62/38. However, investment gains and savings over the year threw it off – this allocation wasn't a given.
A few months ago risky assets were upwards of 80% of our liquid portfolio.
Domestic and International Split in April 2019
Last year, we mentioned that our allocation to international - at 29.5% - felt low. Here's this year:
| Cash & Bonds (Domestic) | 34.72% |
| International Stock | 12.73% |
| Domestic Stock | 52.55% |
So - 87/13 if you care about the safe stuff, 80/20 if you don't.
We're a bit uncomfortable here. There are some excellent arguments for overweighting the United States, of course:
- We plan to retire here (Forex risks are baked in)
- Large public companies already do business overseas (JL Collins has best led the charge on this argument)
- We know the US best
The third argument is, of course, the weakest. Knowing it well introduces bias. Additionally, in theory, buying a well constructed index means we don't need to know a country.
For the record, that 20% allocation is us over-weighting Pacific markets and Europe. We'll watch this, but I'm not as concerned about fixing this bucket as I was in the past.
Style Allocation in April 2019
I broke down our allocation into four styles based on the types of investment:
- Large Cap Stocks (roughly the 5% largest public stocks)
- Medium/Small Cap Stocks (including vested equity in my employer)
- Short Term Debt, Cash, and CDs (<= 2 years duration)
- Intermediate and Long Term Debt
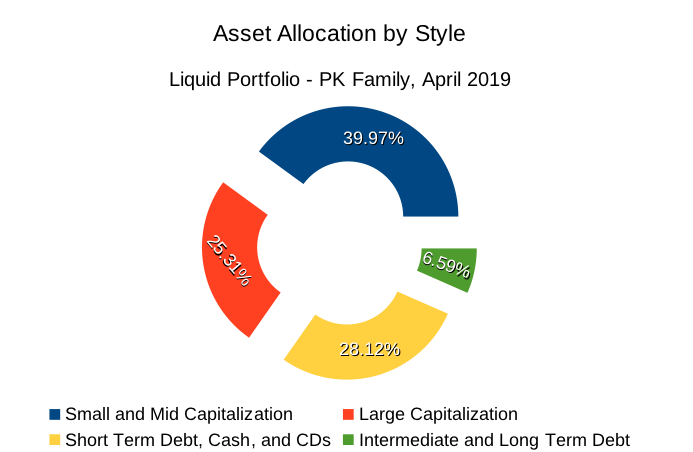
The takeaway here?
We should probably flip our small/mid cap exposure with large cap....
As for the Short vs. Long/Intermediate term disparity? It isn't really fixable with the yield curve in its current state.
Best case, perfectly timed 30 year Treasuries would have yielded 4.85% in April 2010 – buying today gets you under 3% for 30 years. With short term cash yielding over 2% in all our (non-checking) accounts there's really no need to fix this.
Why Bother Messing with Asset Allocations?
Setting aside the fact we had roughly the same percentage of safe & risky assets last year, why bother changing it around? Isn't it market timing to move to only 60% risky assets at our age?
Maybe, but how you define this allocation doesn't phase us. Our goal is to set ourselves up for a minimum of stress in a choppy market.
Imagine: starting with a 60/40 breakdown, where safe assets appreciate by 5% in a fall while risky assets fall 50%. That leaves us around 42/58 risky/safe - and only 28% down!
50% isn't really a random number. That was what the last two bear markets temporarily destroyed in value.
(If stocks surge in 2019 accompanied by a mid 2% return on safe assets? Well, I'll have to fix my allocation for this post next year...)
I don't think working out of a 60/40 breakdown for a while is bad. The trick is, of course!, moving back to a riskier allocation when and if we see a real fall.
How is your asset allocation post-tax season?
