
The Laffer Curve is the idea that cutting taxes spurs economic activity over time. On the Laffer Curve, lower taxes take a smaller slice of a bigger pie increasing revenues overall from the resulting growth from reinvested earnings.
Follow along as we derive the Laffer Curve and talk through some of the assumptions underpinning its usage.
Reactionary Tax Plans and Incentives to Work
When the United States or individual states find themselves short, they tend to want to increase taxes. Likewise, when states and countries find themselves with budget gaps, instead of trimming programs they usually attempt to keep the same level of programs by increasing the tax rate or keeping it level.
The Feds and the states tax production in the form of income taxes. These taxes are a tax on working, or, viewed at another angle, a disincentive to work.
For the Laffer Curve to make sense we need to assume two things:
- If you are working you would prefer not to be taxed.
- If your taxes increase you would like to work less.
If you can agree that high taxes discourage work while low taxes encourage it, you also have to make one more assumption: work is productive. With productive work, the whole country is richer as a result.
Taxation vs. Work
With our assumptions laid out above, let's talk through deriving the curve itself.
Workers are most productive when 100% of the fruits of your labor come back to them. This 0% tax bracket also guarantees no government income tax revenues will be collected.
On the other end of the spectrum is the 100% bracket. I hope you will agree, in a country or state where your labor is taxed at 100% you will, well, not work.
Let's go ahead and make the (dubious) claim that there is a linear reduction in the amount of work you will do for a given tax rate.
Assuming a linear change in work interest, the propensity to work graph therefore looks like this:
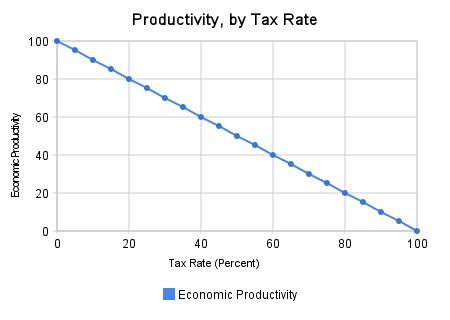
It's not very interesting... but you probably envisioned an image like this in your head. Let's move on.
Taxes Collected vs. Tax Rate
This is only the first step in deriving the curve, though. Next up, we need to find the relationship between the tax rate and government revenues. In this step we want to absolutely maximize government revenues.
Let's add a second series now for the total amount of taxes collected:
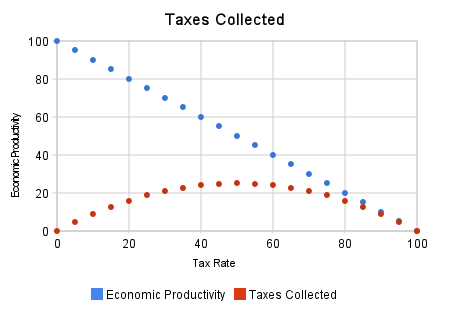
In our theoretical economy and linear falloff in work versus taxes we just sketched, the most "economic units" can be collected with a tax rate of 50%.
If this image seems familiar, you're absolutely correct. You're looking at a very crude Laffer Curve. In our invented fantasy economy, a 50% tax rate means 50 economic units are produced, and the government takes 25 of them. The remaining 25 go to the taxpayers.
The Laffer Curve is Not a Law
The Laffer Curve isn't a law of economics. It's merely a theoretical framework for understanding why, as President John F. Kennedy said in 1962:
"It is a paradoxical truth that tax rates are too high and tax revenues are too low and the soundest way to raise the revenues in the long run is to cut the rates now".
Our fantasy economy and revenue graph is centered at 50%.In a single year, this would perfectly balance workers' propensity to work with government's propensity to tax.
That doesn't mean 50% is the ideal tax rate in a real world economy, howeve. We're ignoring the impact of reinvested earnings.
Many factors will increase or decrease the incentives to work, not just taxes. The United States has very good infrastructure and an excellent law system, for example. On the negative side, states impose taxes making our math harder, and there are taxes on things other than income: consumption taxes, sales taxes, car registration fees, property taxes, etc.
It's also important to note: even if you accept the theoretical underpinnings of the Laffer Curve, tax rates may still currently be too low to maximize revenue and could be increased.
While economic incentives for production will decrease with any tax tweaks to the upside, more revenue will flow to the government's coffers. The Laffer curve is best used as an illustration of the theoretical effects of tax law changes. It has been politicized, but it doesn't necessarily argue we should always cut taxes.
Finishing the Laffer Curve: Increasing Potential GDP
GDP, or gross domestic product, is one way measure of all the goods and services produced in a country. In essence it's a country's overall productivity. If our goal is actually to balance tax revenues with GDP we have one more step in our derivation: we need to account for the effect of reinvested earnings on growth.
(You can easily find the United States's current GDP on FRED.)
In the example economy in our previous article, a tax rate of 50% lead us to a GDP of 50 ""economic productivity units"".
The government takes 25 of these units from our fantasy economy. With the 25 unit remainder, some may be reinvested and increase our future productivity.
We'll have to make a new graph with a new assumption: maximum theoretical economic productivity increases at a rate of 20% of the units which are not taken by the government.
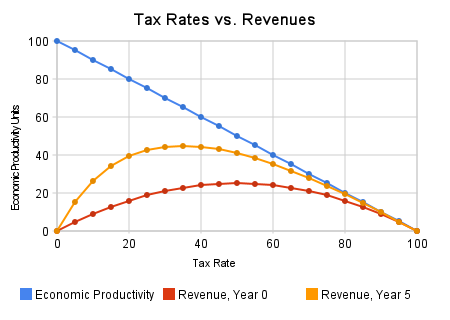
Let's look at some constant tax rates when held over a 5 year span in this new scenario:
Here's how to reproduce this graph:
- Determine the growth rate of the theoretical maximum GDP for each bracket. We're using 20% growth on the amount not taken by taxes.
- Compound the difference to find the theoretical maximum GDP for the year you want (say 5 years).
- Multiply the tax rate by the theoretical max scaled by the amount of productivity you determine will be lost in each tax bracket.
For year 5, I came up with 5% growth a year in the 50% bracket, meaning a theoretical GDP maximum of 163.81. Half of that incentive is gone, so you should calculate the tax on what's left to be 40.95 economic units.
In our wonderfully simple fantasy model, it's better over the 5 year period to tax in the 30% to 40% range because an increasing GDP means the government can draw revenues from a larger tax base.
You can change the numbers as you see fit... different assumptions obviously lead to different numbers. Still, it's time to turn to the real world results.
The Laffer Curve and Hauser's "Law"
Kurt Hauser discovered an interesting fact about tax revenues collected as a percentage of GDP in the United States.
Spanning a huge number of administrations and tax brackets, tax receipts as a proportion of Gross Domestic Product strangely are limited to ~19.5% of GDP.
The Wall Street Journal took a look at Hauser's law in the period from 1950 to 2007 in the United States. Sure enough, even with massive changes in the United States over that 57 year period, the law held true. There is seemingly a maximum limit on the amount government can extract from an economy.
Further, the economics and investing site Political Calculations ran a similar study on personal income tax collections as a proportion of GDP from 1946 to 2006.
Again, the results are astonishing... the average percentage collected as a percentage of GDP is 8%, ranging from 7.2% to 8.8%. They took a look at 1954's steeply progressive tax rate structure versus the structure in 2006 and found that even with the new tax structure, 2006 saw more government revenues even adjusted for inflation.
Where Does Excess Economic Activity 'Go'?
When it comes to tax rate differences between the states, it's easy to imagine that capital and productivity can move into other states. That's why it's disingenuous for states like California to increase tax rates too high, in theory companies can either leave (or never start) in California, but in Arizona or Nevada instead.
On the other hand, country defections are much harder to pull off, but not impossible.
People and companies stay in the United States for more than just taxes. Our affluent consumer base, law system, infrastructure, education system, and security all contribute to attracting people and companies to set up shop and stay in the country. However, with more onerous tax laws, entities may concentrate more of their energy to avoiding taxes than being productive in the first place.
In high tax regimes, workers can decide to work fewer hours overall, reducing total output – an interplay with the substitution and income effects. Some combination of factors leads to a fall off in productivity. You can quibble about the exact numbers, but only a moderate tax system can maximize revenues while encouraging reasonable growth.
In many cases, increasing tax rates does not increase revenues or, it increases them slower than leaving tax rates alone or reducing them would have done after a few years of growth.
It's important that countries (and here, states) keep this in mind when designing their tax brackets. Because growth is spurred with lower tax rates and retained earnings, it's better to err on the lower side of taxes.
