
Editor: we have updated this data after the most recent CPS, and created the Income by State Calculator. You can choose household or individual income.
In this article, we'll look at the individual income per state (and Washington, D.C.) for 2016 CPS data. We've broken down the income earned by those in the workforce for the 10th, 25th, 50th, 75th, 90th and 99th percentile. Data is included for all 50 states and the District of Columbia in choropleths, a table, and a downloadable spreadsheet.
Note that the income data comes from the ASEC, a March survey, so is accounting for full year January to December 2015 data.
What is the Median Income Per State?
First, note that we calculated the median income of workers as $37,848 in 2015. (Our definition of workers is contained in the methodology for our individual income percentile calculator.)
With that in mind, median incomes actually vary quite a bit by state. Here is how they stack up visually:
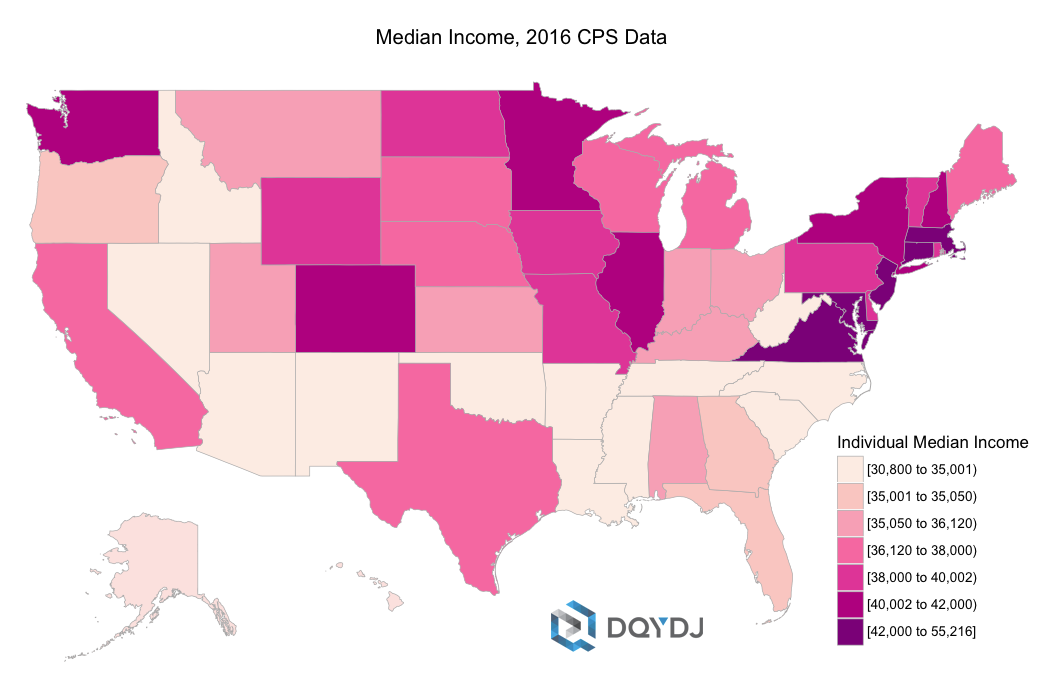
Median Income per State (Click to enlarge)
The highest "state" median income is in the District of Columbia, at $55,216. Among actual states, Massachusetts ranked highest at $45,006.
What Did it Take To Be in the One Percent in Each State?
We also did the math on the top percentile of earners for each state. As you probably guessed, there was a very large variation for the top earners in each state - and if you look carefully, the breakdown doesn't closely match up with the median income choropleth above.
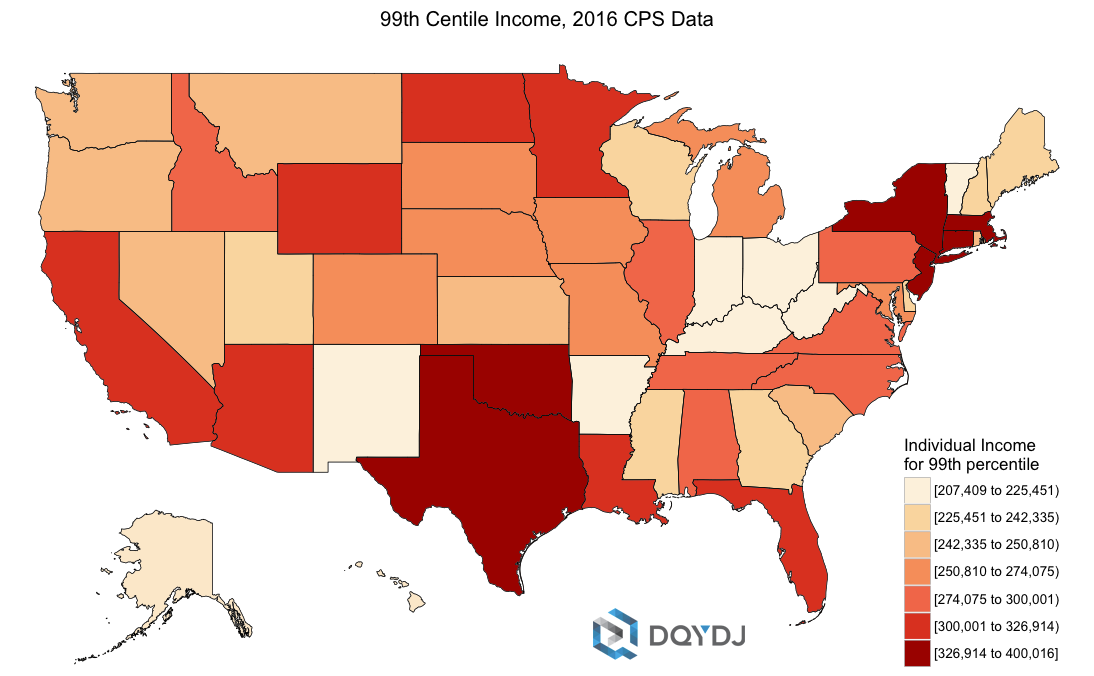
"One Percenter" Income per State (Click to Enlarge)
Connecticut had the highest cutoff to be in the one percent in 2015 at $400,016. Perhaps interestingly, Washington, D.C. had a good showing here as well. It would have required $387,684 to be in the top one percent of income earners in D.C. in 2015.
Methodology and Source for 1%er and Median Income Per State
We get our data from IPUMS-CPS, who do some value-added work on the Current Population Survey.
A brief note on data quality: after splitting by state, Maine has the least data points at 681. Keep that in mind if you go on to use the full data set with all income centiles.
What is the Individual Income Breakdown Per State?
Showing income bands is interesting from a regional variation perspective. It isn't, however, the most precise way to present the data. That in mind, we have reproduced our calculations below.
Here is the individual state income data broken down into the 10th, 25th, 50th, 75th, 90th and 99th percentile. The 99th percentile is often referred to as the 'top 1%' of household incomes. The data below is what it would take to be in the top 1% of income earners in each state.
Income Per State Table for Selected Percentiles
| Income Percentile | 10% | 25% | 50% | 75% | 90% | 99% |
| Alabama | $8,425.00 | $20,000.00 | $35,054.00 | $58,376.00 | $94,000.00 | $274,075.00 |
| Alaska | $11,072.00 | $23,320.00 | $43,080.00 | $73,005.00 | $115,557.00 | $252,030.00 |
| Arizona | $6,505.00 | $18,808.00 | $34,150.00 | $60,000.00 | $92,584.00 | $324,181.00 |
| Arkansas | $10,002.00 | $19,456.00 | $33,325.00 | $54,424.00 | $88,083.00 | $217,924.00 |
| California | $8,500.00 | $19,629.00 | $37,010.00 | $70,097.00 | $120,020.00 | $321,050.00 |
| Colorado | $10,108.00 | $24,450.00 | $40,002.00 | $65,260.00 | $110,000.00 | $270,017.00 |
| Connecticut | $11,141.00 | $23,000.00 | $45,002.00 | $75,168.00 | $122,514.00 | $400,016.00 |
| Delaware | $13,000.00 | $24,000.00 | $40,000.00 | $62,100.00 | $98,000.00 | $227,196.00 |
| District of Columbia | $12,000.00 | $27,000.00 | $55,216.00 | $97,200.00 | $150,200.00 | $387,684.00 |
| Florida | $9,500.00 | $20,000.00 | $35,001.00 | $59,622.00 | $98,881.00 | $301,270.00 |
| Georgia | $9,011.00 | $20,000.00 | $35,002.00 | $62,040.00 | $99,100.00 | $240,054.00 |
| Hawaii | $10,000.00 | $20,002.00 | $36,120.00 | $62,000.00 | $100,001.00 | $216,040.00 |
| Idaho | $9,000.00 | $19,000.00 | $33,025.00 | $55,288.00 | $91,000.00 | $282,655.00 |
| Illinois | $10,000.00 | $21,000.00 | $40,006.00 | $70,003.00 | $111,015.00 | $274,999.00 |
| Indiana | $9,104.00 | $19,500.00 | $35,360.00 | $57,600.00 | $92,000.00 | $222,500.00 |
| Iowa | $10,200.00 | $22,882.00 | $38,000.00 | $61,010.00 | $99,035.00 | $257,600.00 |
| Kansas | $10,100.00 | $20,823.00 | $36,001.00 | $61,000.00 | $101,500.00 | $242,335.00 |
| Kentucky | $7,912.00 | $20,000.00 | $35,481.00 | $58,050.00 | $89,018.00 | $220,359.00 |
| Louisiana | $8,000.00 | $19,400.00 | $35,000.00 | $59,498.00 | $95,035.00 | $301,700.00 |
| Maine | $9,005.00 | $18,950.00 | $37,640.00 | $58,000.00 | $90,001.00 | $237,024.00 |
| Maryland | $12,001.00 | $23,522.00 | $44,049.00 | $76,051.00 | $125,935.00 | $264,145.00 |
| Massachusetts | $10,961.00 | $23,000.00 | $45,006.00 | $77,137.00 | $125,002.00 | $326,914.00 |
| Michigan | $8,500.00 | $20,000.00 | $37,376.00 | $61,702.00 | $100,006.00 | $260,865.00 |
| Minnesota | $11,133.00 | $24,041.00 | $40,861.00 | $69,015.00 | $103,200.00 | $300,010.00 |
| Mississippi | $8,260.00 | $17,510.00 | $30,800.00 | $50,013.00 | $79,796.00 | $237,554.00 |
| Missouri | $10,410.00 | $22,800.00 | $38,115.00 | $62,004.00 | $100,167.00 | $254,000.00 |
| Montana | $9,999.00 | $20,000.00 | $35,050.00 | $60,000.00 | $97,100.00 | $246,700.00 |
| Nebraska | $10,000.00 | $20,360.00 | $37,285.00 | $60,000.00 | $90,250.00 | $250,810.00 |
| Nevada | $8,908.00 | $20,000.00 | $33,075.00 | $57,754.00 | $90,000.00 | $249,999.00 |
| New Hampshire | $11,000.00 | $24,962.00 | $40,510.00 | $70,325.00 | $110,067.00 | $226,016.00 |
| New Jersey | $10,002.00 | $23,000.00 | $45,005.00 | $75,550.00 | $123,032.00 | $331,460.00 |
| New Mexico | $8,520.00 | $18,001.00 | $32,000.00 | $53,000.00 | $87,000.00 | $207,409.00 |
| New York | $10,000.00 | $20,800.00 | $40,025.00 | $72,144.00 | $118,002.00 | $346,266.00 |
| North Carolina | $9,100.00 | $20,000.00 | $35,000.00 | $60,000.00 | $100,052.00 | $298,034.00 |
| North Dakota | $12,000.00 | $23,000.00 | $39,100.00 | $60,102.00 | $95,010.00 | $300,001.00 |
| Ohio | $9,350.00 | $20,000.00 | $35,150.00 | $60,204.00 | $97,001.00 | $209,880.00 |
| Oklahoma | $10,000.00 | $20,000.00 | $35,000.00 | $59,065.00 | $98,776.00 | $330,102.00 |
| Oregon | $8,001.00 | $19,425.00 | $35,003.00 | $62,772.00 | $98,669.00 | $250,050.00 |
| Pennsylvania | $8,176.00 | $20,000.00 | $38,500.00 | $65,023.00 | $100,923.00 | $276,888.00 |
| Rhode Island | $9,360.00 | $21,010.00 | $40,000.00 | $68,451.00 | $101,081.00 | $250,728.00 |
| South Carolina | $8,000.00 | $18,720.00 | $35,000.00 | $55,293.00 | $86,687.00 | $250,231.00 |
| South Dakota | $10,400.00 | $23,010.00 | $37,000.00 | $62,333.00 | $96,356.00 | $252,715.00 |
| Tennessee | $10,000.00 | $20,000.00 | $35,000.00 | $60,081.00 | $98,498.00 | $283,999.00 |
| Texas | $10,000.00 | $20,000.00 | $37,600.00 | $64,854.00 | $108,001.00 | $330,134.00 |
| Utah | $9,000.00 | $20,000.00 | $35,751.00 | $61,502.00 | $100,000.00 | $233,062.00 |
| Vermont | $10,000.00 | $22,005.00 | $39,600.00 | $64,100.00 | $100,316.00 | $210,037.00 |
| Virginia | $10,000.00 | $23,000.00 | $42,000.00 | $73,025.00 | $124,100.00 | $290,100.00 |
| Washington | $10,000.00 | $23,186.00 | $40,955.00 | $71,558.00 | $117,002.00 | $250,029.00 |
| West Virginia | $7,500.00 | $18,500.00 | $34,202.00 | $55,031.00 | $89,200.00 | $220,432.00 |
| Wisconsin | $10,000.00 | $21,003.00 | $36,663.00 | $58,209.00 | $92,002.00 | $225,451.00 |
| Wyoming | $10,401.00 | $22,169.00 | $40,000.00 | $64,219.00 | $97,000.00 | $320,029.00 |
Need More Income Per State Data?
We also have the data on every income percentile from 1% to 99% in every state and D.C. Of course, it's (much) harder to visualize and we didn't want to drown you in visual data. You can find the raw CSV here:
If you do use the data, we'd love a heads up. Be sure to credit IPUMS-CPS as well with whatever you create!
