
The Dow Jones Industrial Average returned +24.39% in 2017. Using a calculation which includes dividend reinvestment, the Dow Jones returned +28.11%.
2017 Dow Jones Industrial Average Return: Reinvest Your Dividends
Those numbers from the introduction are accurate for an index purchase on January 3rd, 2017 sold at close on December 29, 2017. Alternatively, if you bought the closing price on December 30, 2016 the returns would be +25.08% and +28.11%, respectively.
Here are the price returns in table form, including both price and dividend reinvested numbers:
| Price Return | Open | Close | Gain |
| Jan 3, 2017 Start | 19872.86 | 24719.22 | 24.39% |
| Dec 30, 2016 End | 19762.6 | 24719.22 | 25.08% |
And here are the dividend reinvested returns again for both:
| Dividend Reinvested Return | Open | Close | Gain |
| Jan 3, 2017 Start | 41619.65 | 53317.96 | 28.11% |
| Dec 30, 2016 End | 41619.65 | 53317.96 | 28.11% |
(We source our numbers from Marketwatch - as we went to press the dividend reinvested numbers matched for both dates.)
Whichever date you choose, we can't improve our favorite message: dividends matter. Although 25% or 28% are both huge returns, the 28% number is the most accurate to quote. You simply can't ignore the effect of dividends on stock market returns and it's surprising how commonly this simple math is neglected.
Investing in a Price-Weighted Stock Index like the Dow
As compared to other popular indices which are weighted by company market capitalization, (e.g., see the 2017 S&P 500 Return) the Dow Jones Industrial Average is a price-weighted index. Price-weighted indices derive their actual trading prices by the trading price of the underlying company shares which are each multiplied by some factor. Price weighting isn't a good method of creating indices even though it was an excellent invention for its time.
Setting aside matters of construction, the Dow Jones is still an extremely popular index. Consisting of 30 of the top companies in America and representing most industries, Dow Jones volatility can drive financial news like no other index. Those 30 companies are among the largest in America - consequently the DJIA pays out more dividends than most other indices.
It's possible to invest in an ETF that tracks the Dow Jones Industrial Average. DIA is the most popular Dow Jones ETF. There are a few quality mutual funds as well.
Source on the 2017 Dow Jones Industrial Average Return Calculations
Data is from the Dow Jones Industrial Average Total Return Index, from S&P Dow Jones Indices. The chart hails from Marketwatch.
Want more on the Dow Jones Industrial Average? We have a couple tools which can help you research the history of the index.
- Dow Jones Industrial Average Dividend Reinvestment Calculator
A look at DJIA performance with reinvested dividends all the way back to 1896. Unlike this article, it has monthly resolution and uses monthly averages of closing price. - Dow Jones Industrial Average Historical Return Calculator
Using the same monthly data as the return calculator, this calculator works on your choice of timeframes. Enter "lengths of time" and we'll crunch the best, worst, and quantiles of stock returns. Includes inflation, dividends, and price returns.
The 2017 Dow Jones Industrial Average Return
Here's the Dow Jones Industrial Average return chart for 2017 for price performance and with dividends reinvested.
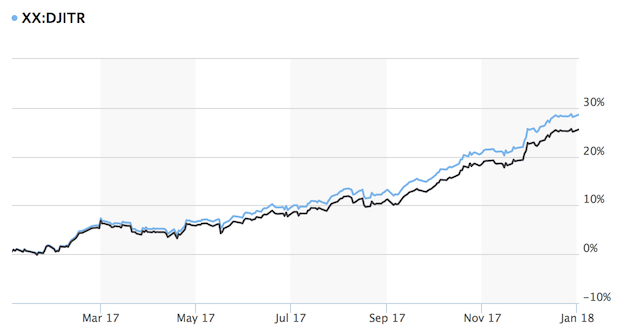
2017 was an epic year for the Dow Jones Industrial Average. It was in the top 22% of the set of all rolling 12-month returns on the Dow.
As we always say, though, your mileage may vary. Varied effects from taxes, slippage, timing, fees, availability and other factors would change the exact number you see. However, if you reinvested your DJIA dividends - or even if you threw them away - you had a great year.
See DJIA returns in other years:
- 2023 Dow Jones Industrial Average Return
- 2022 Dow Jones Industrial Average Return
- 2021 Dow Jones Industrial Average Return
- 2020 Dow Jones Industrial Average Return
- 2019 Dow Jones Industrial Average Return
- 2018 Dow Jones Industrial Average Return
- 2016 Dow Jones Industrial Average Return
- 2015 Dow Jones Industrial Average Return
- 2014 Dow Jones Industrial Average Return
How do you see the Dow Jones Industrial Average performing in 2018?
