
The Dow Jones Industrial Average returned -5.97% in 2018. Using a calculation including dividend reinvestment, the Dow Jones returned -3.48% in 2018.
2018 Dow Jones Industrial Average Return: Reinvest Your Dividends
The numbers above match an index purchase on open on January 2nd, 2018 and sold at close on December 31, 2018. Alternatively, if you bought the closing price on December 29, 2017 the returns would be -5.63% and -3.48%, respectively.
(We source our numbers from Marketwatch. Note the DJIA total return index uses the same price for December 29 close and January 2 open.)
Here are the return numbers in tabular form for the Dow Jones Industrial Average index price:
| Price From | Price | Dec 31 Close | Gain/Loss |
| Jan 2 Open | 24809.35 | 23327.46 | -5.97% |
| Dec 29 Close | 24719.22 | 23327.46 | -5.63% |
And for the (superior) dividend-reinvested total return index:
| Dividend Reinvested From | Price | Dec 31 Close | Gain/Loss |
| Jan 2 Open | 53317.96 | 51462.77 | -3.48% |
| Dec 29 Close | 53317.96 | 51462.77 | -3.48% |
Pick either date; your choice of calendar square doesn't affect the core message: dividends matter. Even in a down year in a rough environment for investors.
Investing in the Dow Jones Price-Weighted Stock Index
Most other popular stock indices are weighted by company market capitalization, (e.g., see the 2018 S&P 500 Return). However, the Dow Jones Industrial Average is a price-weighted index.
Price-weighted indices derive their actual trading prices by the trading price of the underlying company shares which are each multiplied by some factor. Price weighting is not a great indexing method. (It was a huge invention for its time though.)
Setting aside construction, the Dow Jones is still extremely popular. Consisting of 30 of the top companies and covering most industries in America, changes in the Dow Jones drives clicks, views, and financial news. Its 30 companies are among the largest in America - consequently the DJIA pays out more dividends than most other widely tracked indices.
DIA is the most popular Dow Jones ETF if you are interested in investing. There are quality mutual funds as well.
Source on the 2018 Dow Jones Industrial Average Return Calculations
Data is sourced from the Dow Jones Industrial Average Total Return Index, maintained and owned by S&P Dow Jones Indices.
Need more Dow Jones? We have some tools which help your research on the history of the index.
- Dow Jones Industrial Average Dividend Reinvestment Calculator
DJIA performance with reinvested dividends back to 1896. It has monthly resolution and uses monthly averages of closing price. - Dow Jones Industrial Average Historical Return Calculator
This calculator works on your choice of timeframes. Enter "length of time" and we'll crunch the best, worst, and quantiles of stock returns. Includes inflation, dividends, and price returns.
The 2018 Dow Jones Industrial Average Return
Here's the Dow Jones Industrial Average return chart for 2018 for price performance and with dividends reinvested.
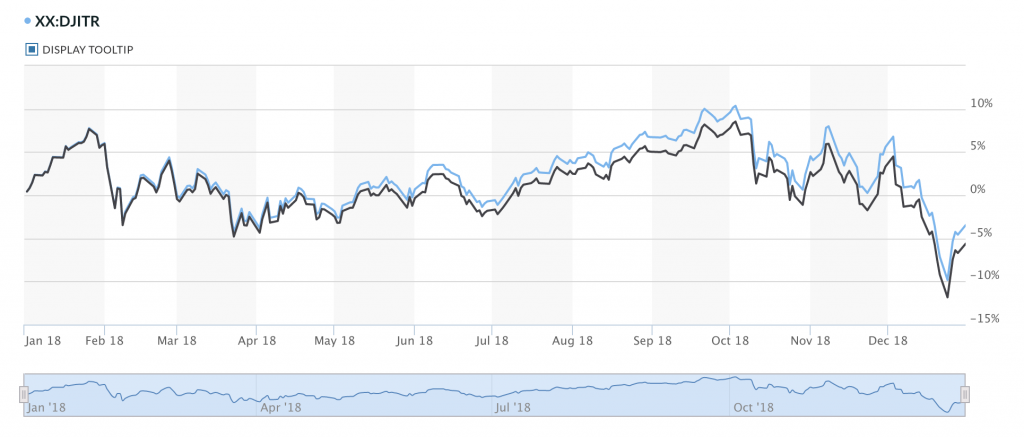
2018 was a rough year for the Dow Jones Industrial Average.
Of course, even down your mileage may vary. Taxes, slippage, timing, fees, availability and other factors would change the exact return number you see even if you bought on one of the selected dates.
However, if you reinvested your DJIA dividends you did better than using your checks for kindling.
See DJIA returns in other years:
- 2023 Dow Jones Industrial Average Return
- 2022 Dow Jones Industrial Average Return
- 2021 Dow Jones Industrial Average Return
- 2020 Dow Jones Industrial Average Return
- 2019 Dow Jones Industrial Average Return
- 2017 Dow Jones Industrial Average Return
- 2016 Dow Jones Industrial Average Return
- 2015 Dow Jones Industrial Average Return
- 2014 Dow Jones Industrial Average Return
How do you see the Dow Jones Industrial Average performing in 2019?
